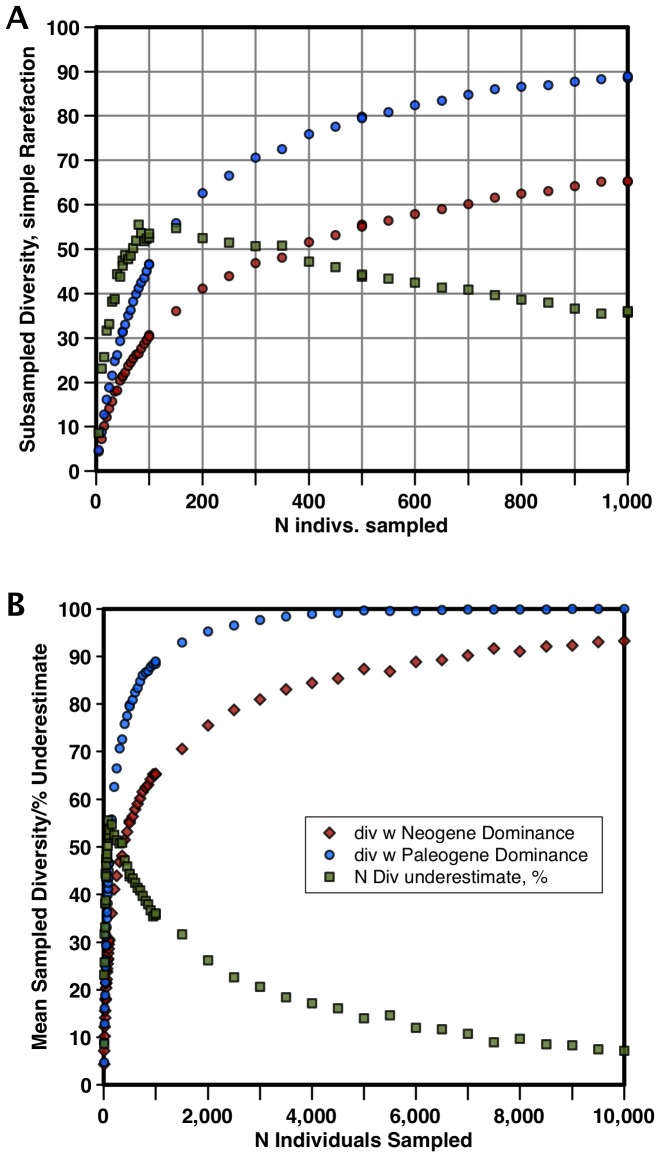
Figure 3. Results of simple rarefaction subsampling two virtual computer populations of equal diversity (100 taxa) and total sample size but with averaged Neogene or Paleogene relative abundance distributions as seen in NSB diatom occurrence data.
a) for subsample sizes between 0–1,000; b) subsample sizes 0–10,000. Blue dots - Paleogene subsampled diversity; red - Neogene subsampled diversity; green squares - percentage underestimation of Neogene diversity relative to Paleogene diversity. Each point is an average of 50 subsampling trials. Age scale: [43].

