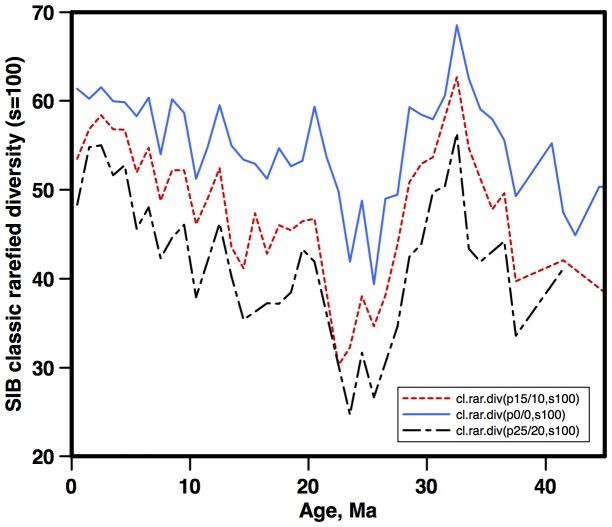
Figure 4. Subsampled diatom diversity (sample size = 100) from the NSB database, using different levels of Pacman trimming of data from the ends of species ranges (7) to remove outliers due to possible data errors in NSB.
Blue solid line - no data trimming; dashed red - 15% of the youngest and 10% of the oldest occurrences for each species removed; alternate dashed black - 25% of the youngest and 20% of the oldest. Age scale: [43].

