
Figure 5. Multivariate classification and regression tree model.
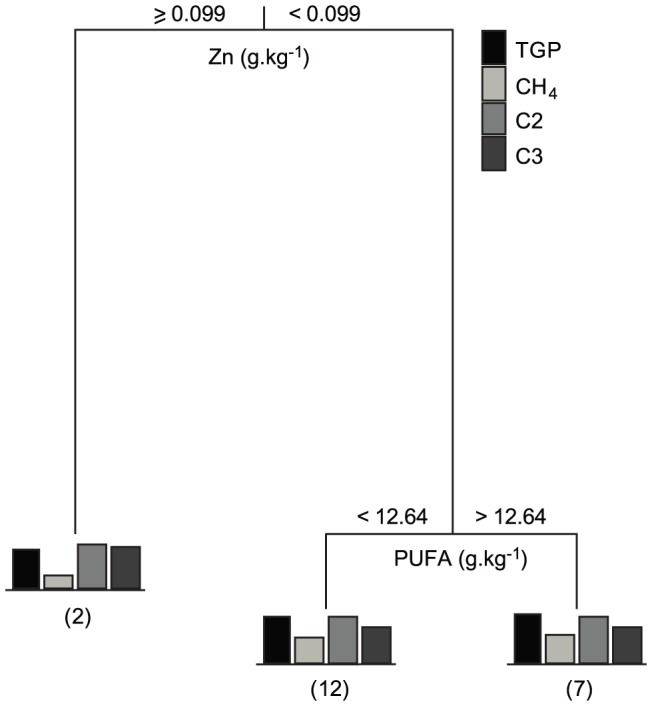
This CART is based on biochemical variables explaining 79.1% of the variability in total gas production (TGP), CH4 production, and acetate (C2) and propionate (C3) molar proportions. Data was fourth-root transformed. Numbers in brackets indicate the number of species grouped in each terminal branch.