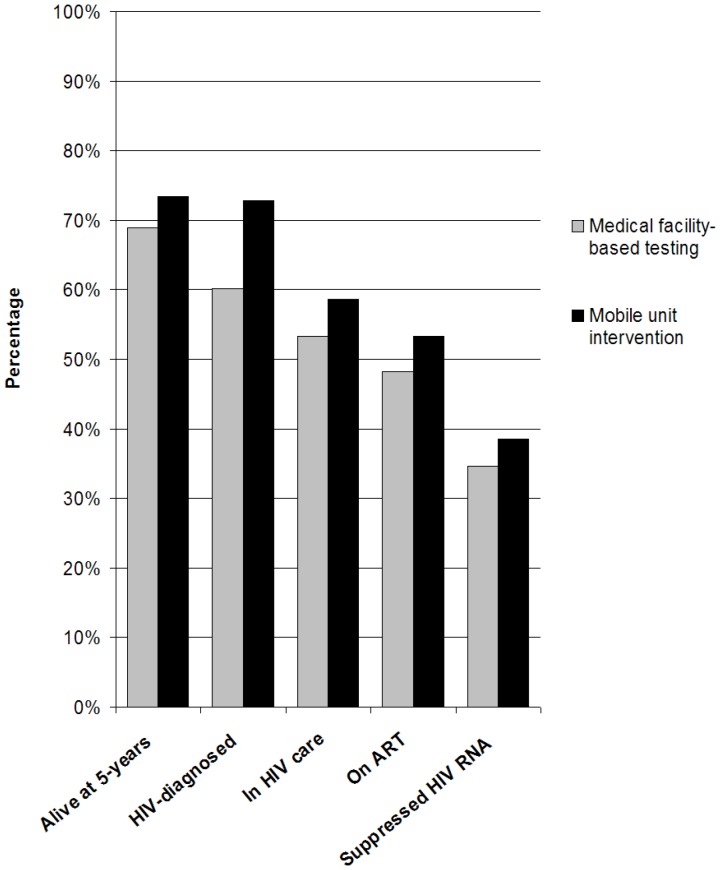
Figure 2. Model-derived survival and engagement in care of HIV-infected individuals in Cape Town at 5 years from the start of observation.
The bar graphs shows the proportion (out of the initial 1,240 HIV-infected population) at 5 years who are alive, diagnosed, linked to and retained in care, are on ART, and are HIV RNA suppressed on ART. HIV: human immunodeficiency virus, RNA: ribonucleic acid, ART: antiretroviral therapy.

