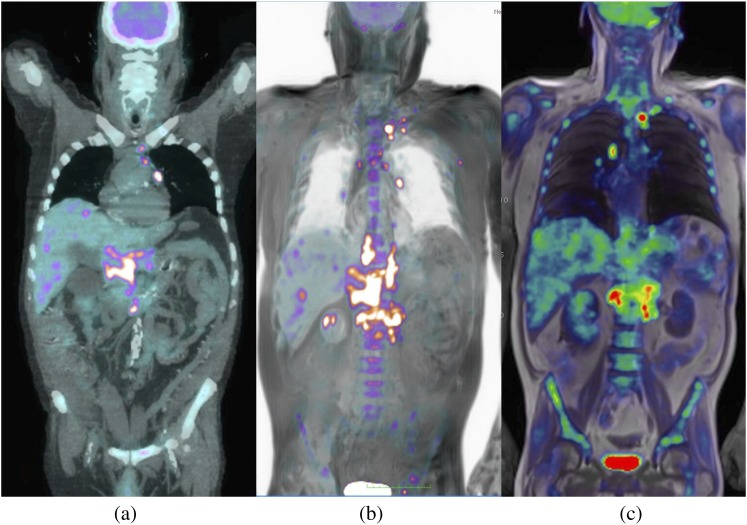
Figure 10.
18F-fludeoxyglucose positron emission tomography (PET) CT scan (thick multiplanar reformat) (a) shows multiple confluent nodes above and below the diaphragm. Multiple liver lesions are also seen. Cross-sectional PET-MRI (b) maximum intensity projection and (c) volume-rendered reconstruction show similar appearances.

