
Fig. 10.
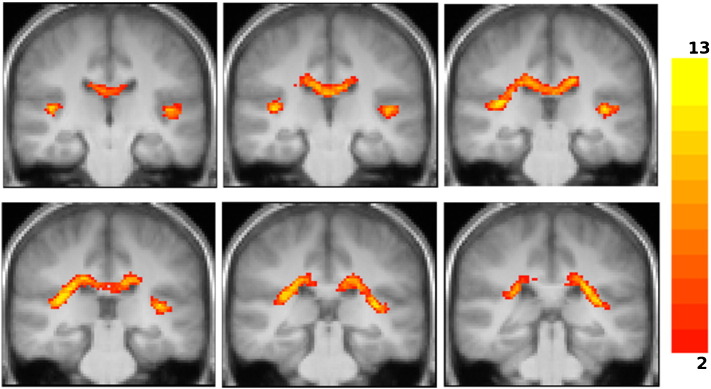
Group fascicles connecting right and left sound auditory cortexes via the corpus callosum overlaid onto the group-average T1 image of our subjects in MNI space (radiological convention). The signal intensity is proportional to the number of subjects in which the tracts were identified. Only tracts identified in two or more subjects are depicted.