
Figure 2. Visualization of in vitro experiments and simulation results.
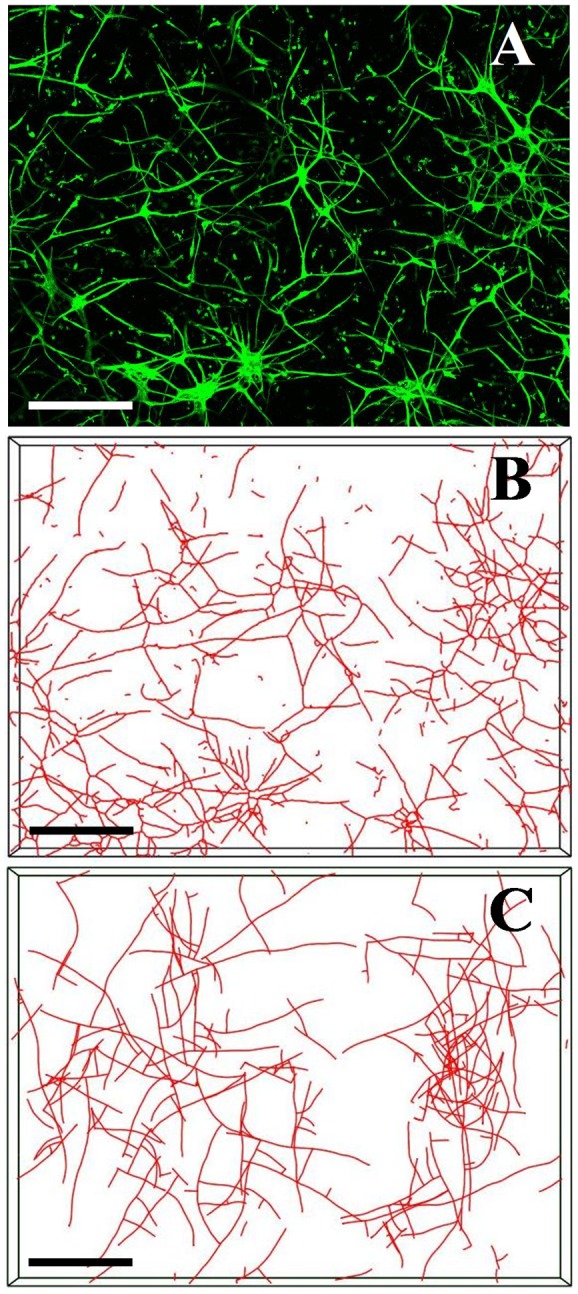
The computational model was designed to simulate angiogenic outgrowth and neovascularization within 3D organ culture of microvessel fragments with a type-I collagen gel. All images in this figure depict the 3.8×2.5×0.2 mm region that was imaged during the experiments.(A) Z-projection mosaic of 3D confocal image data showing microvessels cultured in a 3.0 mg/ml collagen gel after Day 6 of culture. Endothelial cells within the culture were labeled with Isolectin IB4-Alexa 488 and imaged using a confocal microscope with a 10× objective. (B) Skeletonized vessel data obtained from the confocal image data of a vascularized collagen gel in Panel A. (C) Results of a simulation using the computational model. Microvessels were represented as a collection of line segments, and growth was simulated by the addition of new segments to the free ends of existing segments. (Scale bar = 350 µm).