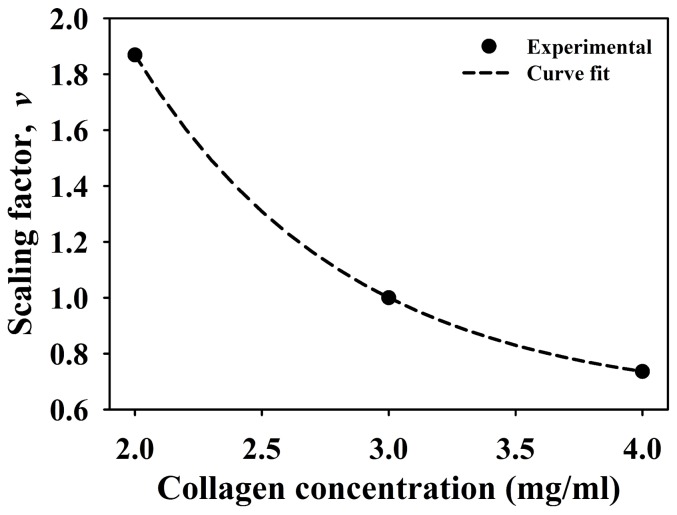
Figure 6. Matrix density scaling factor.
A scaling factor was calculated from experimental data and used to scale growth rate and branching probability within the computational model based on local ECM density. The factor was calculated by taking the average total vascular length measured for the 2.0, 3.0, and 4.0/ml vascularized constructs and normalizing by the total vascular length for the 3.0 mg/ml construct. Experimental data is presented as the solid points on the graph. This data was then fit to the exponential function described in Eq. 3 (R2 = 1.0). The fitted function is presented as the dashed line on the graph.

