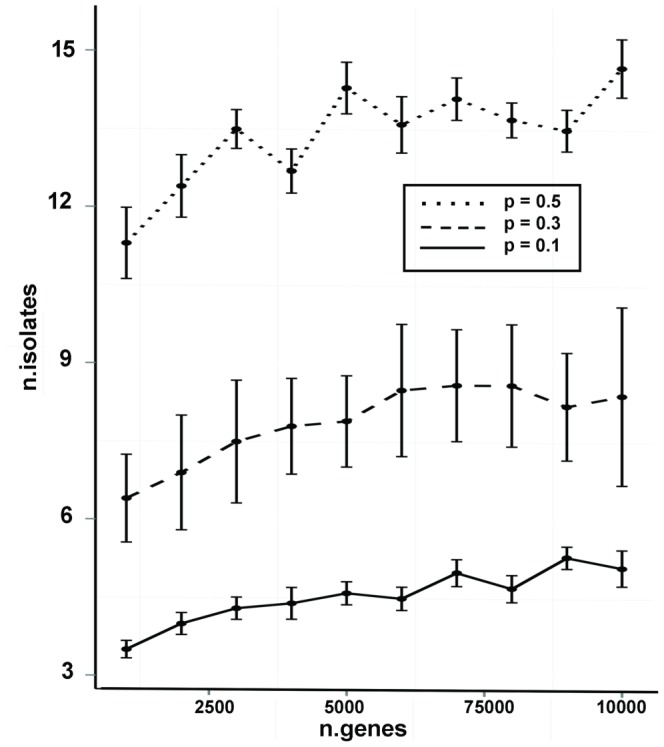
Figure 5. Simulation analysis for the minimum number of isolates.

The x axis is the total number of genes in the passenger set, and the y axis is the number of isolates required for identifying a stable set of altered genes. The error bars show the standard errors for 10 replicates.
