
Fig. 6. Conformational equilibrium of integrin αVβ3.
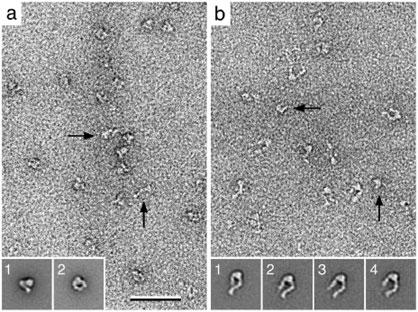
a: Image of αVβ3 in the presence of inhibiting Ca2+ ions, where most of the molecules adopt a compact, closed conformation (insets 1 and 2 show representative class averages). Some of the molecules however can be seen in an extended, open conformation (arrows). b: In the presence of activating Mn2+ ions, the situation is reversed and most molecules are in the extended conformation (insets 1 to 4 show representative class averages), while only few molecules adopt the compact conformation (arrows). The scale bar corresponds to 50 nm and the inset panels have a side length of 40 nm. Figure 4 modified and reprinted from (9). Copyright 2002 with permission from Elsevier.