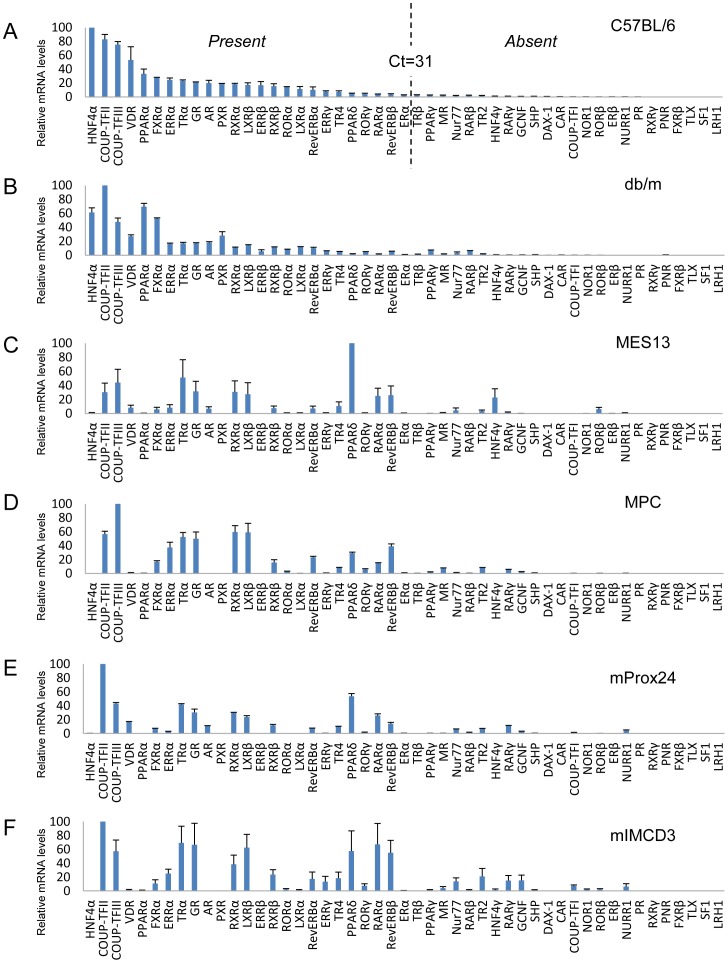
Figure 2. Comparative expression levels of 49 nuclear hormone receptors (NHRs) in mouse kidney tissue and renal cell lines.
The relative mRNA levels are depicted for mouse kidney (C57BL/6 (A) and db/m (B)) and mesangial (MES13) (C), podocyte (MPC) (D), proximal tubular epithelial (mProx24) (E) and collecting duct (mIMCD3) (F) cell lines. All values are expressed relative to 18S and arithmetically adjusted to depict the highest-expressed NHR for each tissue/cell line as a unit of 100. Values represent the means ± SEM of three independent samples of each tissue or cell line. Setting arbitrary cutoffs at Ct<31 (present) or Ct>31 (absent), as shown by broken lines in the C57BL/6 mouse kidney panel, reveals that 25 NHRs were expressed and six NHRs were not detected in C57BL/6 mouse kidney.

