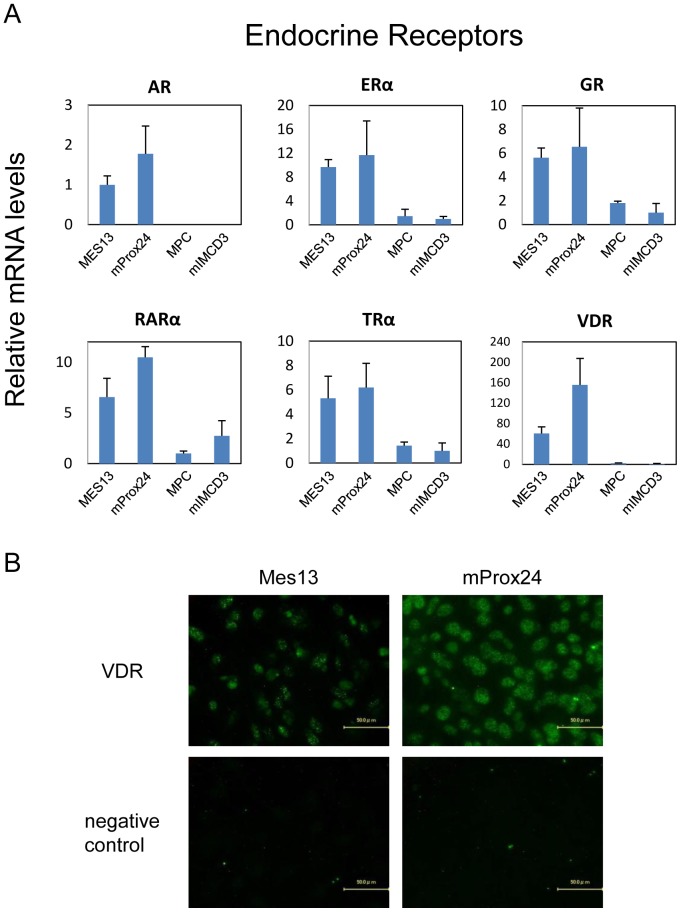
Figure 3. Endocrine receptors expressed in renal cell lines.
(A) The relative mRNA levels are depicted for mesangial (MES13), podocyte (MPC), proximal tubular epithelial (mProx24), and collecting duct (mIMCD3) cell lines. All values are expressed relative to 18S and arithmetically adjusted to depict the lowest-expressing sample as a unit of 1. Values represent the means ± SEM of three independent samples of each cell lines, and the results are representative of two independent studies. (B) Representative photomicrographs of immunofluorescent staining. Vitamin D receptor (VDR) was predominantly expressed in mProx24 cells, and to a lesser extent in MES13 cells.

