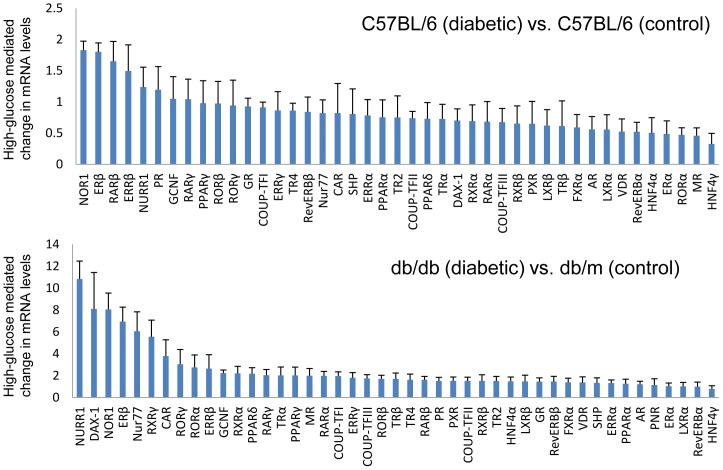
Figure 6. Comparative expression levels of NHRs in mouse kidney tissue under high-glucose conditions.
The relative mRNA levels are depicted for streptozotocin-induced diabetic C57BL/6 mouse kidney compared with control C57BL/6 mouse kidney (upper panel), and diabetic db/db mouse kidney compared with control db/m mouse kidney (lower panel). Values depict the means ± SEM of three independent samples.

