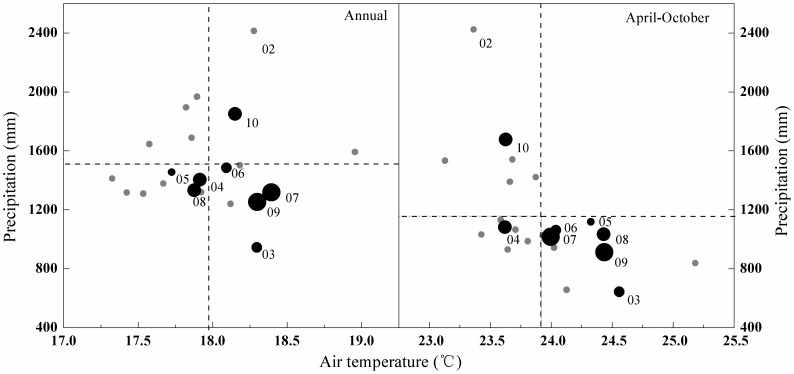
Figure 1. Cumulative precipitation versus average air temperature of the whole year and the growing season (April–October) during the period 1989–2010.
For the period of 2003–2010, the size of black dot is approximately proportional to the ET amount. The two-digit numbers (YY) denote the years from 2003 to 2010 (20YY). Dotted lines represent the averages over the 20 year period.

