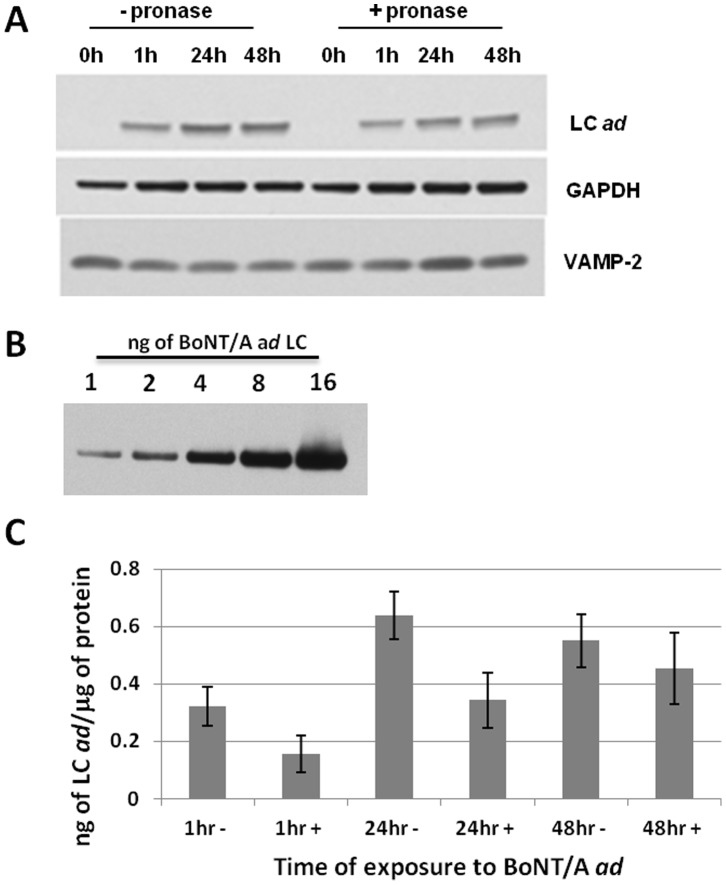
Figure 3. Intracellular accumulation of BoNT/A ad.
E19.5/A ad at 37°C. Panel A: Western blot analysis after incubation of the cells with BoNT/A ad for 1, 24, or 48 hours, followed by treatment with pronase E or control (see Materials and Methods). Protein concentration was normalized to GAPDH. VAMP-2 loading controls were used to demonstrate absence of synaptic protein degradation in experiments with pronase E treatment. Panel B: Western blot of indicated amounts of BoNT/A ad LC developed with F 1-40 mAb. This panel was used to generate the standard curve for LC ad quantification. Panel C: Quantification of the amount of LC ad per µg total protein (see Materials and Methods). The experiment was performed in triplicate.

