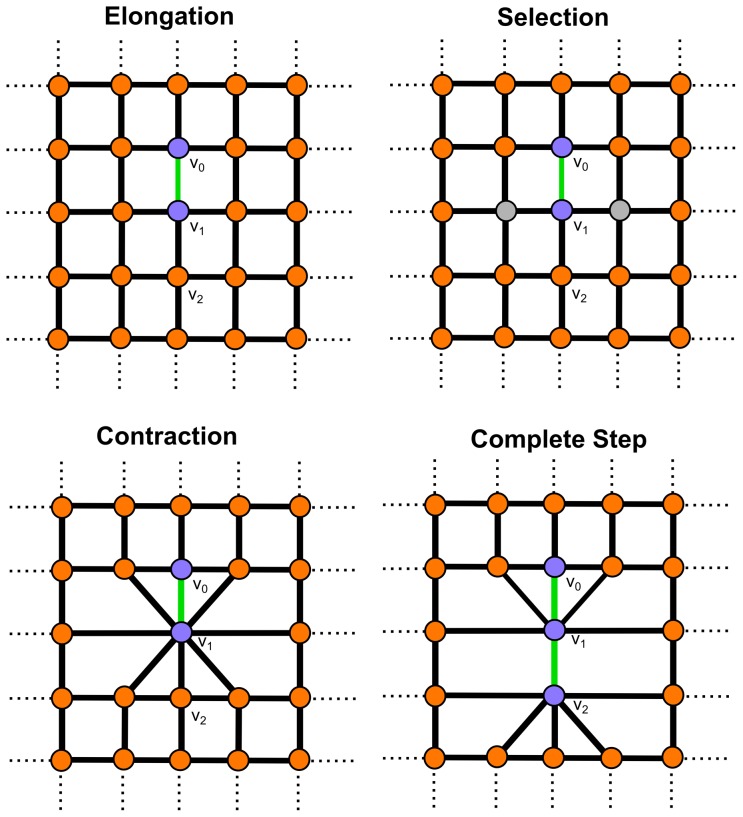
Figure 4. Fiber walk on a 2D lattice.
Elongation occurs as the first step which is chosen randomly between the edges incident to the origin  (compare Fig. 3). Here the chosen edge to reach
  is shown in green. Selection of vertices incident to the walk from the side correspond to the expansion. The vertices selected to be merged with
  are shown in grey. Contraction of the selected vertices and its result after merging the selected vertices to
  . Another step, including elongation and expansion, is shown as a second step on the lattice. The second step reaching
  uses the same color schema as before.

