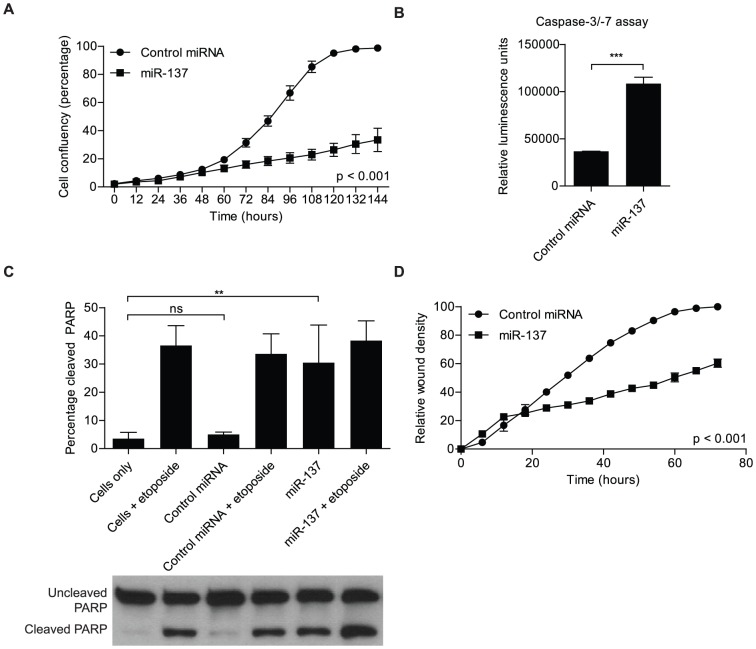
Figure 1. Impact of miR-137 mimics transfection on cancer relevant processes.
A) miR-137 transfection into U251 glioblastoma cells inhibits cell proliferation (p<0.001, multiple comparison tests between groups). U251 cells were transfected with miR-137 or control miRNA and plated at a low density (500 cells per well). Cell proliferation was monitored using the Essen Bioscience IncuCyte automated microscope system and read out as percentage confluence. The experiment was monitored over a course of 6 days. The data was analyzed using analysis of variance, and the data is presented as the mean ± standard deviation. B) miR-137 transfection into U251 glioblastoma results in increased apoptosis, measured by caspase-3/-7 luminescent assay. Caspase-3/-7 activity, an indicator of apoptosis induction, increased after miR-137 transfection, as compared to the control miRNA transfection. Data was analyzed with Student's t-test and is presented as the mean ± standard deviation. *** indicates p≤0.001. C) miR-137 transfection into U251 glioblastoma cells results in increased apoptosis, measured by Western blot of poly(ADP) ribose polymerase (PARP) cleavage. PARP cleavage, an end event of apoptosis, increased after miR-137 transfection, as compared to the control miRNA transfection. Etoposide (25 µM) was used as an inducer of apoptosis. Data was analyzed with Student's t-test and is presented as the mean ± standard deviation. ** indicates p≤0.01. α-tubulin was included as an endogenous loading control. D) miR-137 transfection into glioblastoma cells results in decreased ability to migration (p<0.001, multiple comparison tests between groups). U251 glioblastoma cells were transfected with miR-137 or control miRNA. An in vitro scratch assay was used to measure the ability for cell migration. The assay was monitored using Essen Bioscience IncuCyte automated microscope system. The data was analyzed using analysis of variance, and the data is presented as the mean ± standard deviation.

