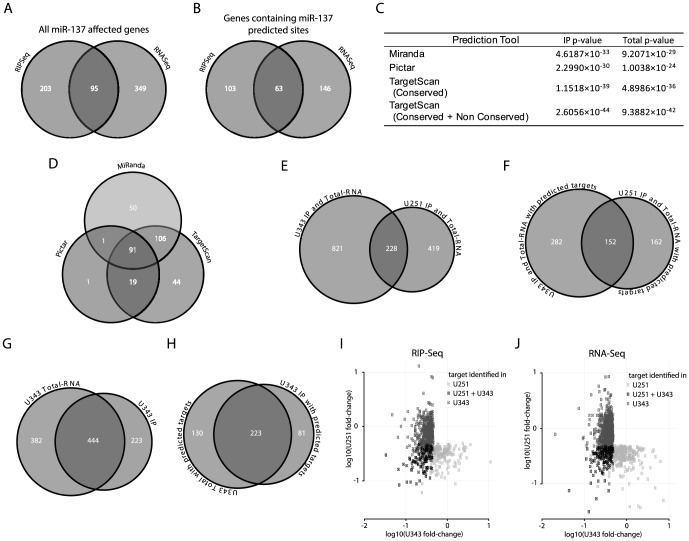
Figure 2. Analysis of miR-137 impact on glioblastoma expression by two genomic approaches.
A) Venn diagram shows the number of genes affected by miR-137 mimics transfection in U251 cells obtained by RNASeq and RIPSeq approaches. B) Venn diagram shows the number of genes identified by our approaches containing miR-137 predicted targets according to TargetScan, Miranda or Pictar. C) Hypergeometric test determined the significance of results of the two approaches used to identify miR-137 targets. D) Venn diagram shows the distribution of genes containing miR-137 predicated sites (from B) according to prediction tools. E) Venn diagram showing the number of genes identified by either the RIPSeq assay or the RNASeq assay in U251 cells, U343 cells, and both cell types. F) As in panel E, but considering only genes that were predicted as miR137 targets by Miranda, Pictar or TargetScan. G) Venn diagram showing the number of genes identified as miR137 targets in U343 cells by the RIPSeq assay, the RNASeq assay and both. H) As in panel G, but considering only genes that were predicted as miR137 targets by Miranda, Pictar or TargetScan. I) The average log10-fold-change in U251 cells (y-axis) and U343 cells (x-axis) is shown for all genes identified as miR137 targets by the RIPSeq assay in either U251 or U343 cells; genes (points) are colored by whether they were identified in only U251 cells, only U343 cells, or both. J) As in panel I, but for the RNASeq assay.

