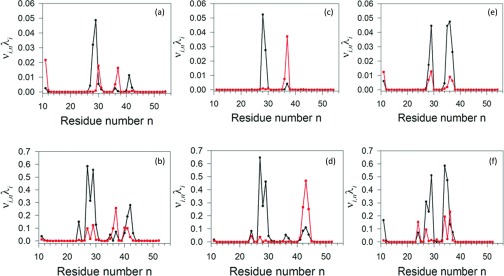
Figure 29.

Contributions (νi, n, λi) of principal mode 1 (black) and mode 2 (red) to the mean-square fluctuations along the θ ((a), (c), and (e)) and γ ((b), (d), and (f)) angles, respectively, in the time windows from 0 to 4.89 ns ((a) and (b)), 4.89 to 9.78 ns ((c) and (d)), and from 9.78 to 14.67 ns ((e) and (f)).
