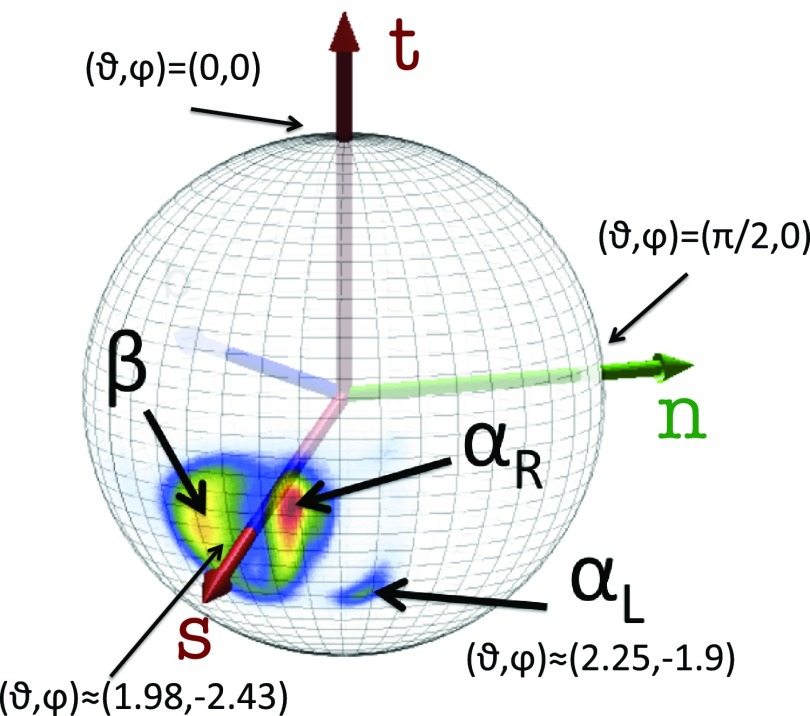
Figure 5.
Statistical distribution of the Cβ direction in the PDB, as seen from the corresponding Cα, located at the center of the sphere. The vector t points towards the next Cα. The regions of right-handed αR-helices, β-sheets, and left-handed αL are displayed, the rest being non-regular structures (including loops). The (average) vector s is also shown.

