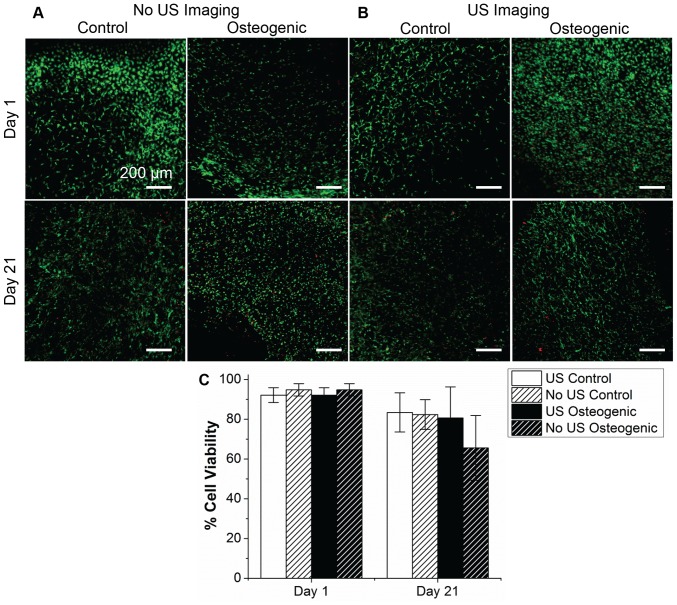
Figure 3. Comparison of cell viability at day 1 and 21 of MC3T3 cells seeded in collagen constructs, in either control or osteogenic media (cytoplasm of living cells is stained green, nuclei of dead cells is stained red).
Constructs in (A) were not imaged using ultrasound, while those in (B) were imaged using ultrasound. Bar plot in (C) shows quantification of cell viability calculated from the images. Scale bar = 200 µm. Best viewed in color.

