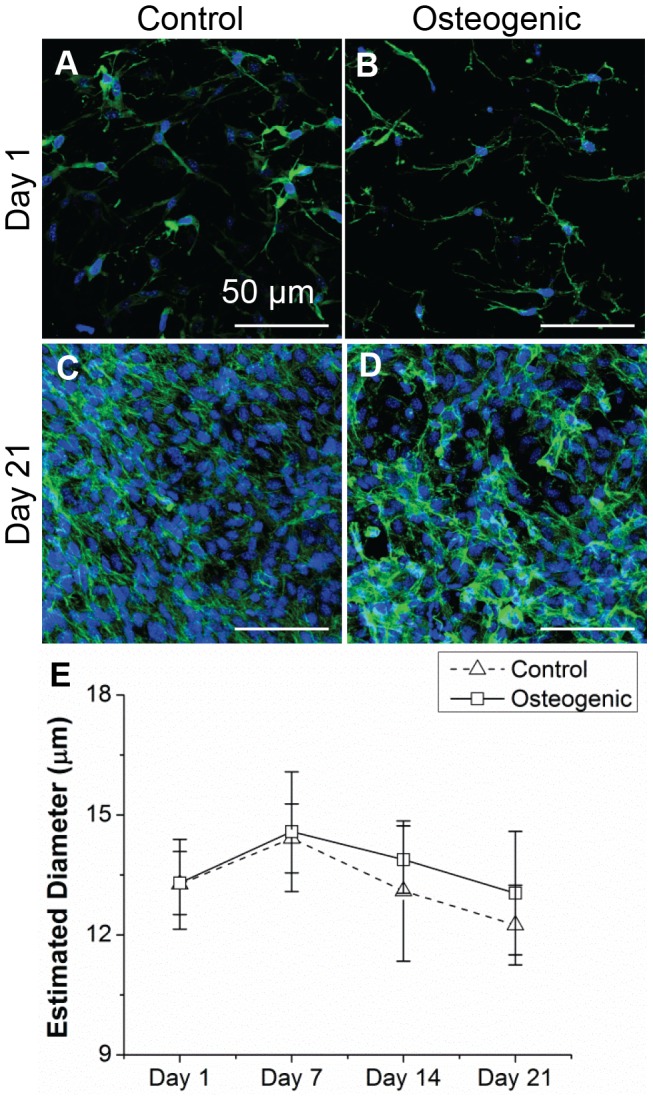
Figure 5. Developmental changes in sizes of MC3T3 cells seeded in collagen constructs.

(A) –(D) Fluorescence staining of MC3T3 cells embedded in collagen constructs in control and osteogenic media on day 1 and day 21 (actin cytoskeleton is stained green, nuclei are stained blue). (E) Estimated diameter of cells from SUSI analysis over time in culture. Scale bar = 50 µm. Best viewed in color.
