
Figure 2. Typical example of a hippocampus of P20, stained with Nissl (A, B), immunohistochemistry for active-caspase-3 (C) and Ki-67 (D).
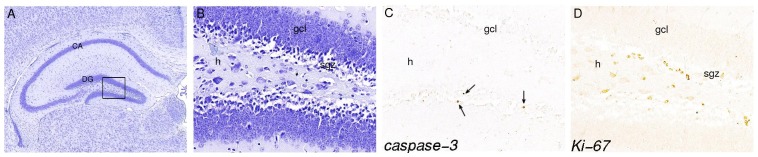
Panel B, C and D represent a magnification (40×) of the boxed area in panel A (10×). Arrows in panel C show apoptotic cells in gcl. Proliferative cells are detected in the sgz of the DG. h = hilus, gcl = granule cell layer, sgz = subgranular zone.