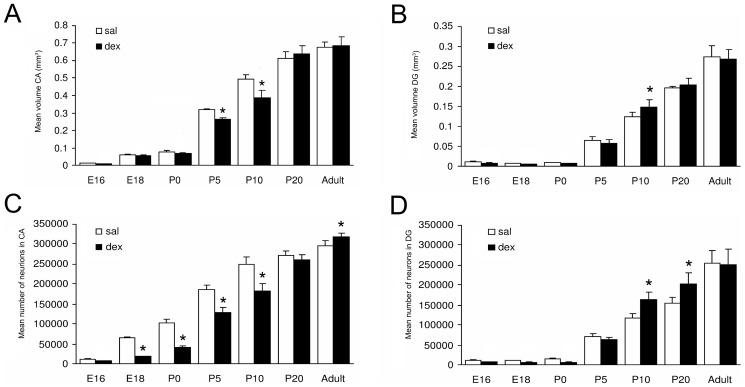
Figure 3. Effect of antenatal dexamethasone treatment on the volume (A, B) and total number of neurons (C, D) of the hippocampus.
Data are presented as mean ± SD. Panel A and C show a significant decrease in volume of the CA at P5 and P10 and in total number of neurons in the CA area at E18 until P10 and an increase of number of neurons in the CA of the dex-treated group at adulthood. Panel B shows an increase in volume of the DG of the dex-treated group at P10. Panel D shows a significant increase in total number of neurons in the DG of the dex-treated group at P10 and P20. Sal: saline-treatment (n = 8), dex: dexamethasone-treatment (n = 8). * p<0.05 (Two-Way ANOVA+Bonferroni).

