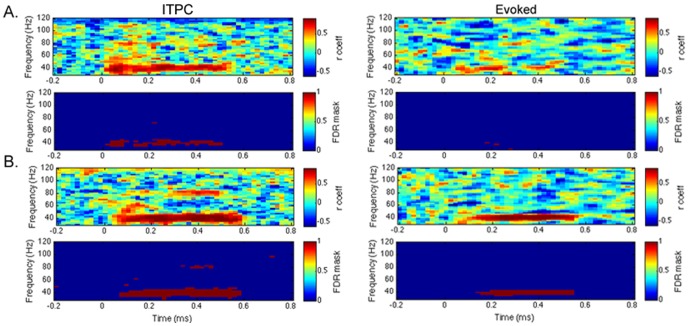
Figure 3. Example of correlation results.
Correlation results between sessions 1 and 2 for inter-trial phase coherence (ITPC) and evoked activity for white noise stimuli (A) and click train stimuli (B) for the sensor-level analysis at the channel with the peak 40 Hz auditory steady-state response (FCz). In each plot, the first row shows the correlation coefficient (r coeff) and the second row shows correlations that were significant following multiple comparison correction (FDR, q = 0.05; 0/blue = not significant, 1/red = significant).

