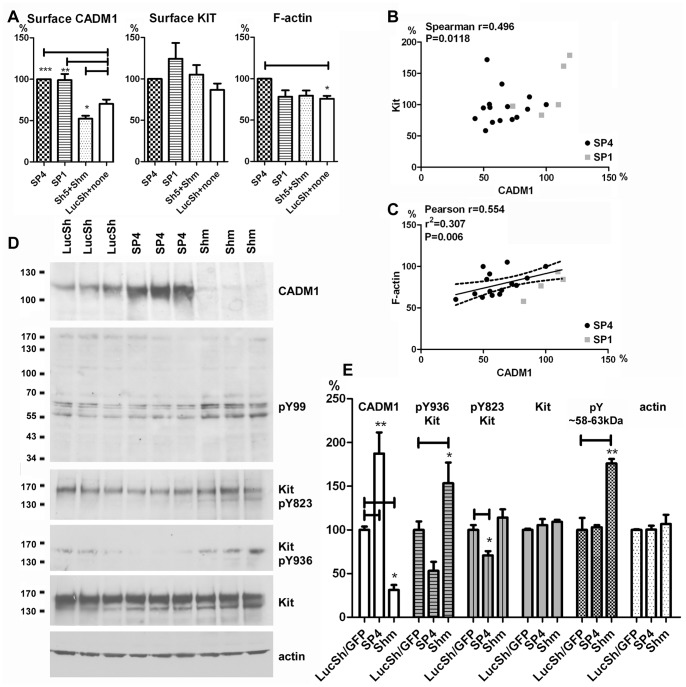
Figure 2. Modulated CADM1 levels in HMC-1 cells influenced surface Kit expression, an assembly of filamentous actin and tyrosine phosphorylation.
A. HMC-1 cells were transduced with SP4, SP1, control shRNA LucSh, CADM1 shRNA (Sh5 or Shm) viral particles. Then examined for expression of surface CADM1 (total n = 30 groups from 7 transductions), surface Kit (n = 27 from 7 transductions) and amounts of F-actin (n = 23 from 4 transductions) by FACS. The control group combines LucSh-transduced and non-transduced cells, CADM1 downregulated group combines Sh5- and Shm-transduced cells. All data were expressed as a percentage of the levels in the SP-overexpressing cell group. B and C. Scatter plots for the data presented in A with correlation or regression model parameters are shown for Kit (B) and F-actin (C) as a function of CADM1. Data for SP4- and SP1-expressing cells are shown in different colours. D. Western blotting of protein extracts from LucSh-, SP4- and Shm-transduced HMC-1 cells, with 3 independent transductions for each group, developed with Abs shown on the right of the blots. E. Protein bands, shown in D and Fig. S2C , were quantified. Bands in SP4 (n = 5) and Shm (n = 4) groups were expressed as percentages of control LucSh/GFP group (n = 5) for each protein, except phosphotyrosine 58–63 kDa bands (n = 3). * P<0.05; ** P<0.01; *** P<0.001.

