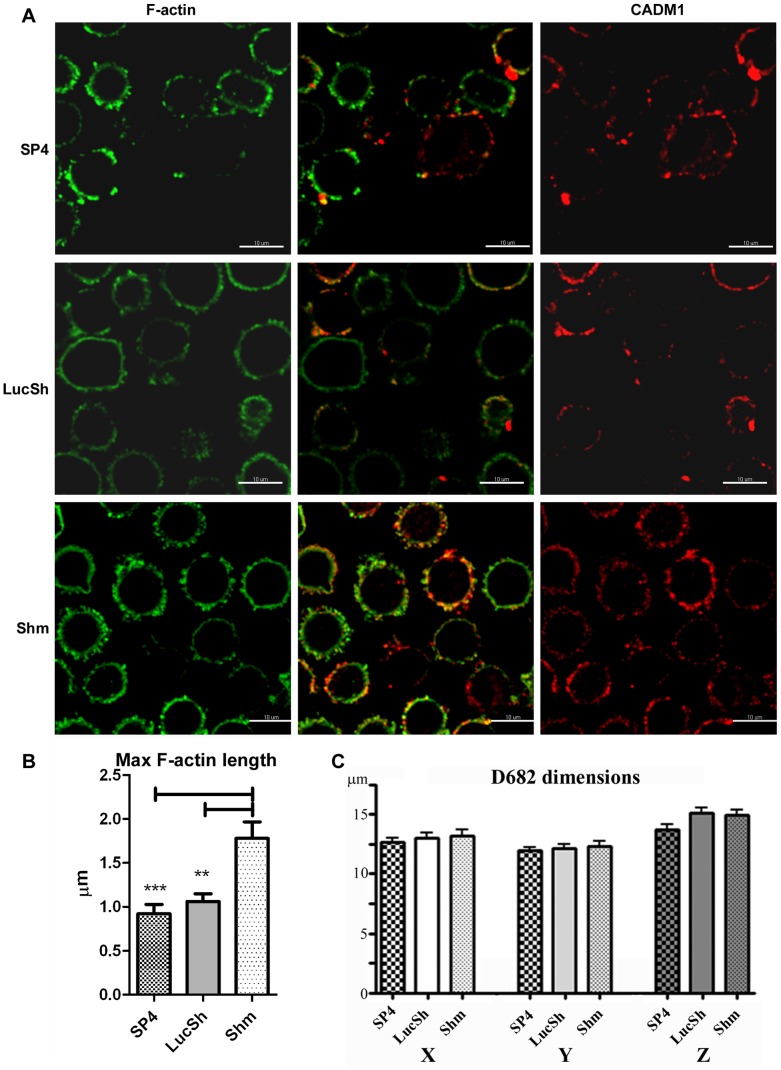
Figure 7. CADM1 Downregulation in human lung mast cells increased the length of cortical actin filaments.
LucSh-, SP4- and Shm-transduced HLMCs D682 from an experiment shown in Fig. 3A and 3E were stained for F-actin and surface CADM1. Glass slides with HLMCs in suspension were examined by confocal laser scanning microscopy. The same optical section of the cell surface is shown for each protein. F-actin and CADM1 are shown in false colours. Bar is 10 µm. B. The maximal length of actin filaments was measured as the means of 4 longest filaments on the cell membrane for each examined cell, then the data for all groups of transduced cells were analysed (n = 10 cell for each group). **, P<0.01; ***, P<0.001. C. The maximal and minimal cross-sectional (X, Y) and Z axial distances were measured and analysed for LucSh- (n = 13), SP4- (n = 9) and Shm-transduced (n = 15) cells.

