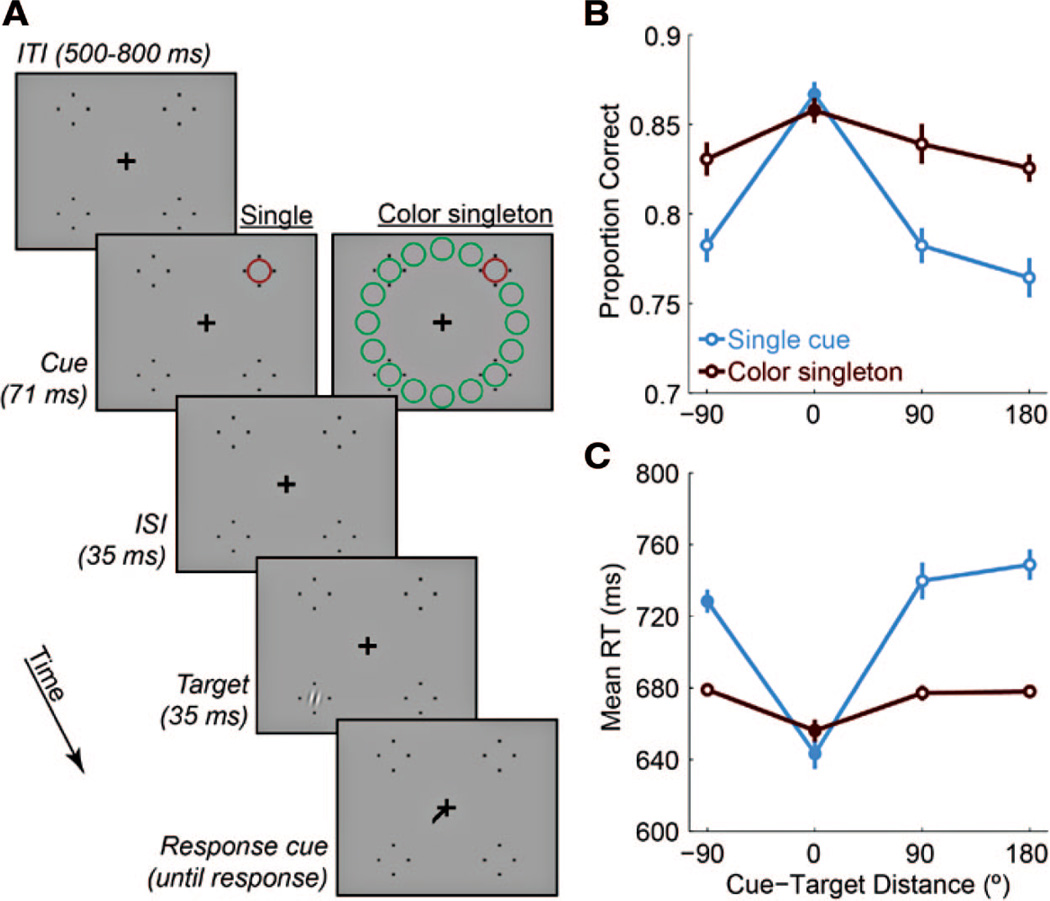
Figure 4.
Experiment 3. A, Example trial sequences with red cues and cue-target distances of 180°. B, Accuracy data as a function of cue-target distance for both cue types. C, RTs on correct trials. Cue-target distance of −90 indicates that the cue and target were in the same hemifield. Filled symbols indicate significant differences from 180° (p < .05, corrected).

