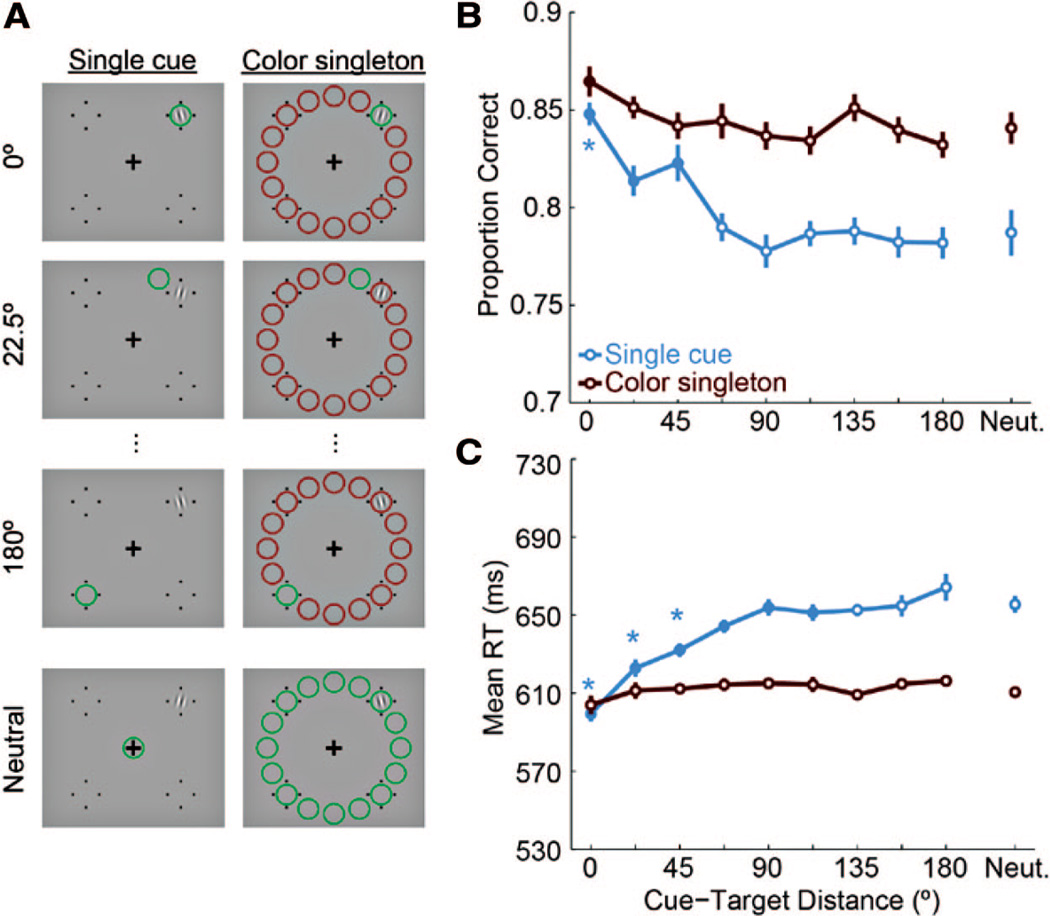
Figure 5.
Experiment 4. A, Example displays of varying cue-target distance with the cue, target, and response cue all together for the purposes of illustration (the timing was the same as in Experiment 1A). B, Accuracy data. C, RTs on correct trials. Filled symbols indicate significant differences from 180°; asterisks indicate significant differences from the corresponding neutral condition (p < .05, corrected).

