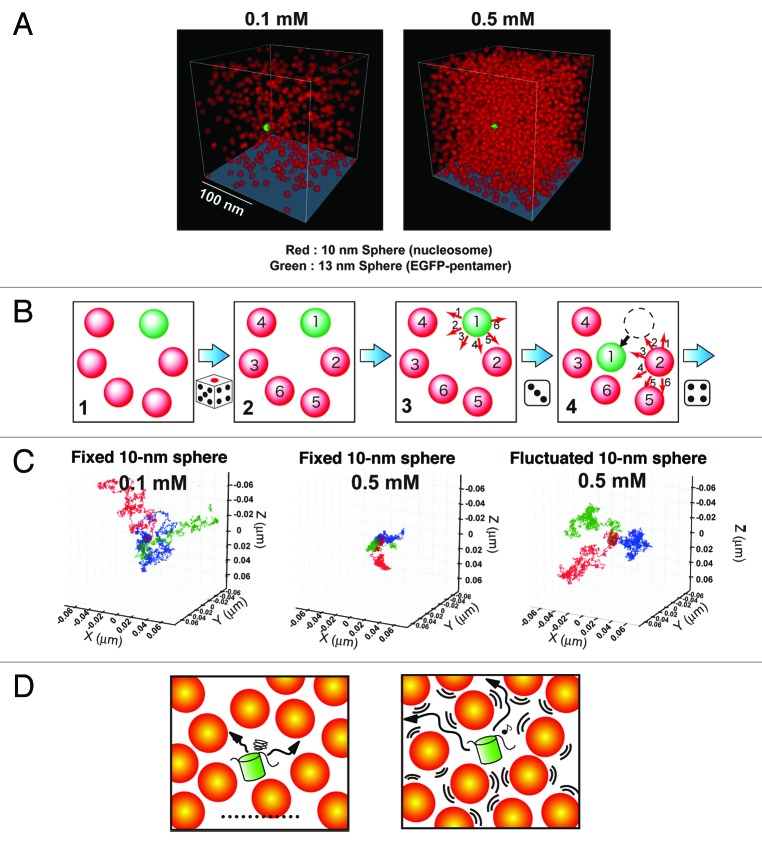
Figure 2. Reconstruction of the living chromatin environment using Monte Carlo computer simulation. (A) The nucleosome is represented as a 10-nm red sphere and fixed in a restricted space at a concentration of 0.1 mM (left) or 0.5 mM (right, corresponding to mitotic chromatin) randomly but in a manner that avoids any overlap. The EGFP-pentamer is represented as a 13-nm sphere (green). See also Videos S1 to S3. (B) A simple scheme of the simulation procedure. For the details, see text. (C) Tracing patterns of three 13-nm spheres (EGFP-pentamers) under various conditions. At 0.1 mM of fixed 10-nm spheres (nucleosomes), the 13-nm spheres (EGFP-pentamers) move around freely (left image). However, at 0.5 mM of fixed 10-nm spheres (nucleosomes), the 13-nm spheres (EGFP-pentamers) are unable to move far from their starting points (middle image). In the environment with a fluctuation of 0.5 mM of the 10-nm spheres (nucleosomes), the 13-nm spheres (EGFP-pentamers) can move around freely (right image), in contrast to the case of the fixed 10-nm spheres (nucleosomes, middle image). Each 10-nm red sphere (nucleosome) behaves like “a dog on a leash.” The leash length is 20 nm. The three different temporal trajectories of the 13-nm spheres (EGFP-pentamers) for 0.2 ms are indicated in blue, green, and red. (D) Cartoons showing that a protein (green) is stacked in a confined space of fixed nucleosomes (left), and the protein is able to move freely with fluctuation of the nucleosomes (right).

An official website of the United States government
Here's how you know
Official websites use .gov
A
.gov website belongs to an official
government organization in the United States.
Secure .gov websites use HTTPS
A lock (
) or https:// means you've safely
connected to the .gov website. Share sensitive
information only on official, secure websites.
