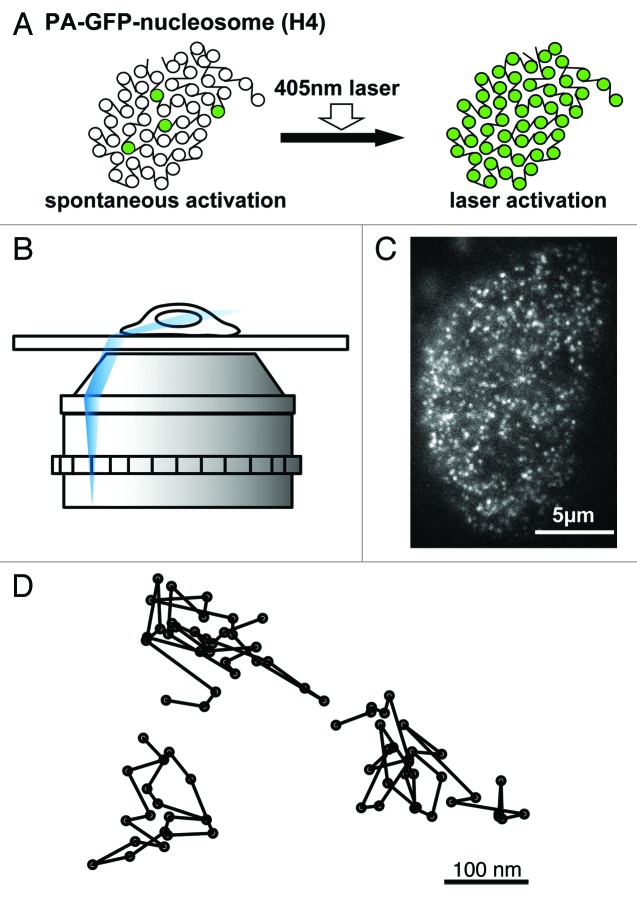
Figure 3. Single nucleosome imaging. (A) Generally, PA-GFP shows GFP fluorescence only after activation by a 405-nm laser (right). However, a small fraction of PA-GFP-H4 was spontaneously activated without laser activation (left) and was used for our single-nucleosome imaging. (B) A schematic representation of the oblique illumination microscopy (HILO system, ref. 37). We used Nikon laser TIRF microscope system Ti with Sapphire 488 nm laser (Coherent). Using a sheet light (blue), a limited area in the cell is illuminated. (C) Single-nucleosome image of a DM cell nucleus expressing PA-GFP-H4. PA-GFP-H4 observed as a bright dot using the oblique illumination microscopy system. For single-nucleosome tracking, the free software, u-track,49 was used. The dots were fitted to an assumed Gaussian point spread function to determine the precise center of signals with higher resolution.34 (D) Representative trajectories of fluorescently tagged single nucleosome.

An official website of the United States government
Here's how you know
Official websites use .gov
A
.gov website belongs to an official
government organization in the United States.
Secure .gov websites use HTTPS
A lock (
) or https:// means you've safely
connected to the .gov website. Share sensitive
information only on official, secure websites.
