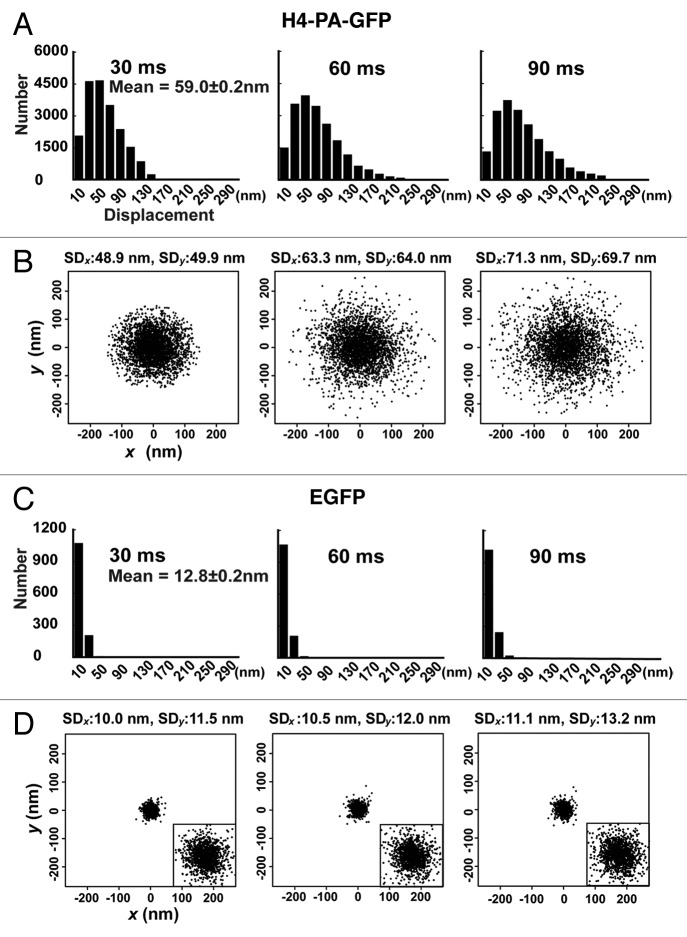
Figure 4. Single nucleosome analysis of H4-PA-GFP. (A) Displacement (movement) histograms of single nucleosomes in interphase DM cells for 30 ms (left), 60 ms (center), and 90 ms (right; n = 20 000 in seven cells). The mean displacement ± standard error for the 30 ms time point was indicated. (B) Distribution of nucleosome displacements in the x-y plane for 30 ms (left), 60ms (center), and 90 ms (right). n = 3 000 in seven cells. Standard deviations (SDx and SDy) were shown. In panels (A) and (B), the originally calculated displacement was in two dimensions. To obtain their 3D values, the two-dimensional values of displacement were multiplied by (). (C) Displacement histograms of single EGFP on a glass surface for 30 ms (left), 60 ms (center) and 90 ms (right; n = 1 300). The mean ± standard error for the 30 ms time point was indicated. (D) Distribution of EGFP displacements in the x-y plane for 30 ms (left), 60ms (center), and 90 ms (right; n = 1 300). Standard deviations (SDx and SDy) were shown. The insets are 3-fold magnified images of the distributions.

An official website of the United States government
Here's how you know
Official websites use .gov
A
.gov website belongs to an official
government organization in the United States.
Secure .gov websites use HTTPS
A lock (
) or https:// means you've safely
connected to the .gov website. Share sensitive
information only on official, secure websites.
