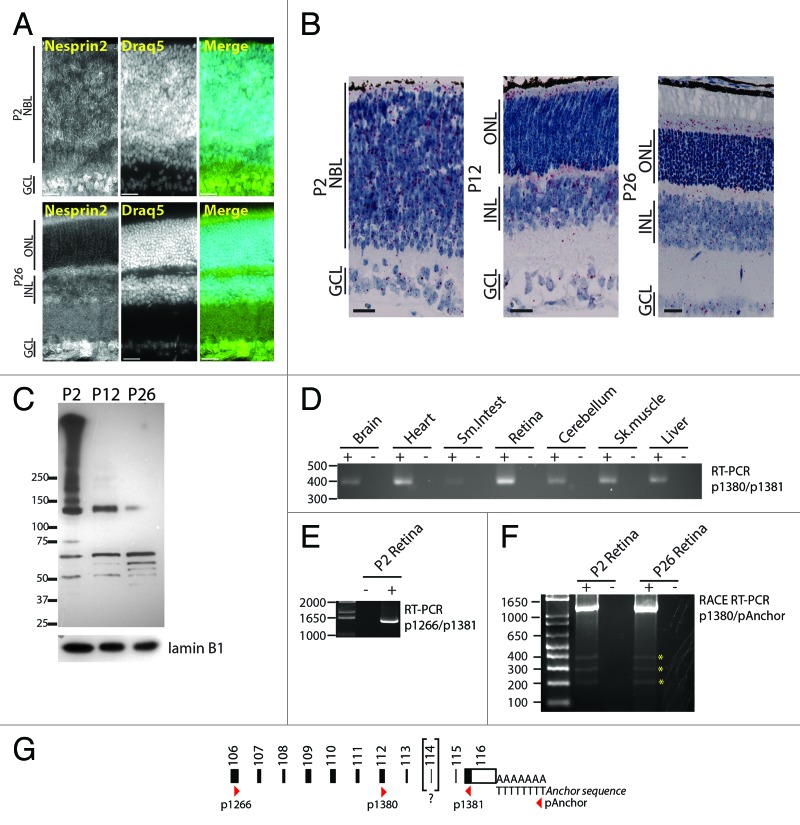
Figure 6. Expression pattern of nesprin2 in the developing retina. (A) P2 (top), and P26 (bottom) retinas were stained with an affinity purified nesprin2 antibody and counterstained with DRAQ5. Note the homogenous expression of nesprin2 in the NBL of P2 retinas. Scale bars: 25 µm. (B) In situ hybridization on P2 (top), P12 (middle) and P26 (bottom) retinas using probes recognizing the C-terminal region of nesprin2 mRNA. Scale bars: 25µm. (C) Immunoblotting of P2, P12, and P26 retina lysates with an affinity purified anti-nesprin2 antiserum. Note the downregulation of multiple high molecular weight bands as retinogenesis proceeds. LaminB1 was used to control for comparable loading. (D) RT-PCR amplification of nesprin2 transcripts from total RNA extracted from the indicated mouse tissues using the p1380/p1381 primer pair. (E) Same experiment as in (D) with the p1266/p1381 primer pair on retina total RNA. (F) 3′RACE RT-PCR performed on total RNA extracted from P2 and P26 retina using the p1380 specific forward primer and the reverse pAnchor primer. Asterisks denote non-specific amplified bands. (G) Localization of primers used in PCR reactions relative to the C-terminal exons of nesprin2 transcripts. Bracketing of exon 114 reflects its absence in all amplicons sequenced in this study.

An official website of the United States government
Here's how you know
Official websites use .gov
A
.gov website belongs to an official
government organization in the United States.
Secure .gov websites use HTTPS
A lock (
) or https:// means you've safely
connected to the .gov website. Share sensitive
information only on official, secure websites.
