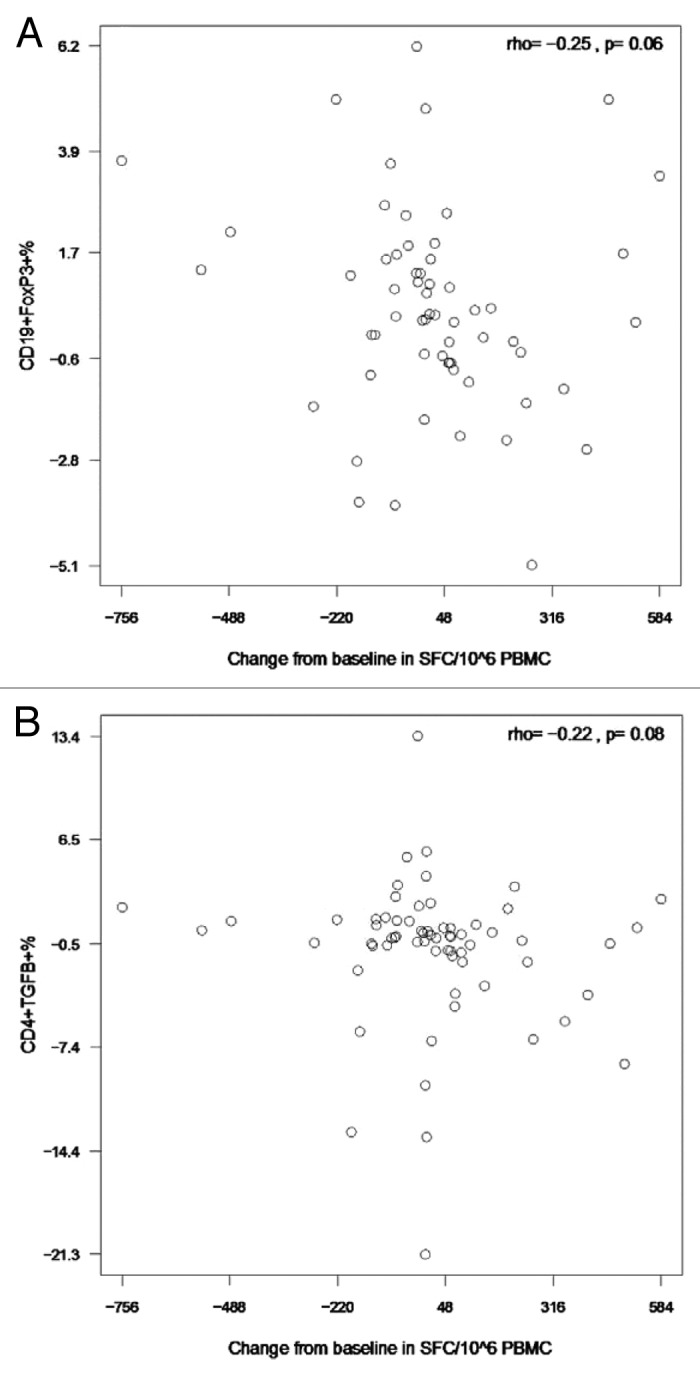
Figure 5. Correlations of pH1N1-stimulated IFNγ ELISPOT results after the first immunization with CD19+FOXP3+ % Breg (A) and CD4+TGFβ+% Treg (B) after the first immunization. Data were derived from 63 and 66 participants in panels A and B, respectively. PBMC, frozen and thawed to preserve viability, were rested overnight. ELISPOT assays were performed only on PBMC with viability ≥ 70% immediately after thawing and after resting. The assays used MabTech kits and live pH1N1 viral infection to promote stimulation of both CD4+ and CD8+ T cells. Flow cytometric assays were also performed on PBMC with viability ≥ 70%. Cells were incubated with pH1N1 live virus or medium control for 48h after which they were stained as described in the methods section. The x axes represent the difference between baseline and post-dose 1 IFNγ ELISPOT results. The coefficients of correlation and p values shown on each graph were calculated using Spearman correlation test.
