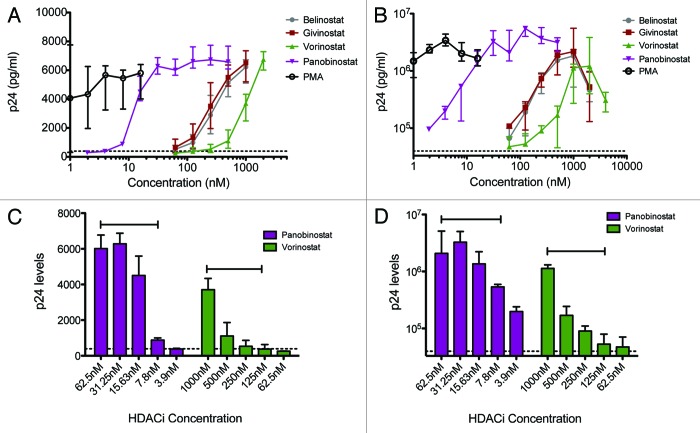
Figure 1. HIV-1 expression in U1 and ACH2 cells treated with HDAC inhibitors. HIV-1 expression in U1 and ACH2 cells treated with panobinostat (LBH589), belinostat (PXD101), givinostat (ITF2357), vorinostat (SAHA) and valproic acid (VPA) for 48 h; median +/− IQR p24 concentrations of 15 (ACH2) and 8 (U1) separate experiments in each cell line are depicted in graphs A and B. Comparison of median +/− IQR induced viral production with indicated concentrations of LBH589 or SAHA is shown in C and D. Capped lines above error bars indicate the range of therapeutic plasma levels for each HDAC inhibitor. Dotted line indicates p24 levels in untreated cells.

An official website of the United States government
Here's how you know
Official websites use .gov
A
.gov website belongs to an official
government organization in the United States.
Secure .gov websites use HTTPS
A lock (
) or https:// means you've safely
connected to the .gov website. Share sensitive
information only on official, secure websites.
