
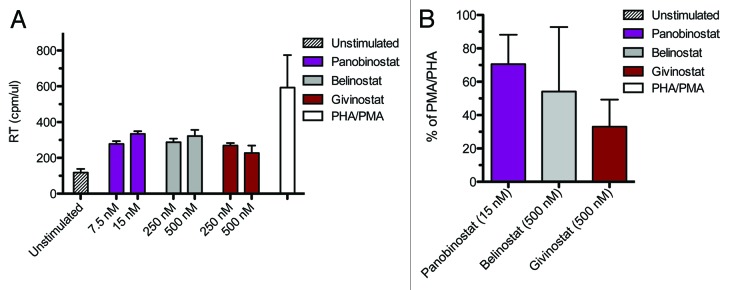
Figure 4. HIV-1 expression in latently infected primary CD4+ T cells. Panel A displays HIV-1 expression in latently infected resting CD4 T cells treated with panobinostat (LBH589), belinostat (PXD101), givinostat (ITF2357) and PMA/PHA for 72 h; mean +/− SEM RT/cpm. Panel B shows the percentage stimulation relative to the induction observed with PMA/PHA panobinostat (15 nM), belinostat (500 nM) and givinostat (500 nM); mean +/− SEM. Results are from two donors with each stimulation performed in duplicate.