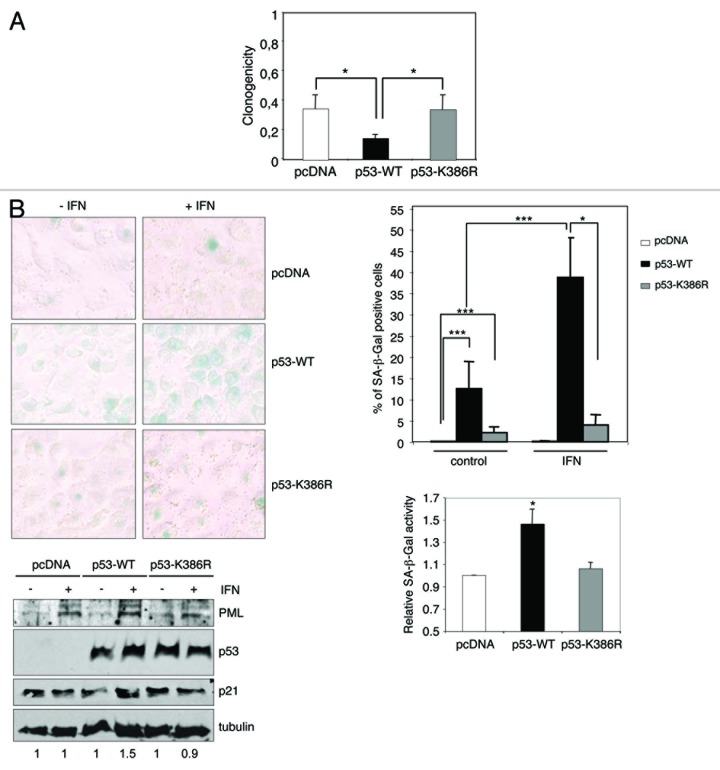
Figure 4. IFN treatment induces cellular senescence in a p53 SUMOylation-dependent manner. (A) Increased sensitivity of p53-WT cells to IFN-α. The clonogenic capacity of H1299 cells treated with IFN-α was assessed. The colony number relative to untreated cells (average +/− SD of triplicates) is shown. *P < 0.05, Student t test when comparing the reduction in the clonogenicity of pcDNA or p53-K386R- and p53-WT-expressing cells. (B) SUMOylation of p53 contributes to the senescence program induced by IFN. Representative pictures of SA-β-Gal staining (upper-left panel) and quantification of data, showing the percentage of SA-β-Gal-positive cells (upper-right panel). Data shown average +/−SD from 2 independent experiments. Fold change in the fraction of p53-WT- or p53-K386R-expressing cells that were positive for SA-β-Gal staining after IFN-α treatment relative to the change observed in the control cells (lower-right panel) (average +/−SD from 4 independent experiments) *P < 0.05, ***P < 0.0005, Student t test. Western blot analysis of protein extracts from cells treated or not with IFN-α (lower-left panel). Numbers under the bands, densitometric analysis showing fold change in p21 levels compared with untreated cells.

An official website of the United States government
Here's how you know
Official websites use .gov
A
.gov website belongs to an official
government organization in the United States.
Secure .gov websites use HTTPS
A lock (
) or https:// means you've safely
connected to the .gov website. Share sensitive
information only on official, secure websites.
