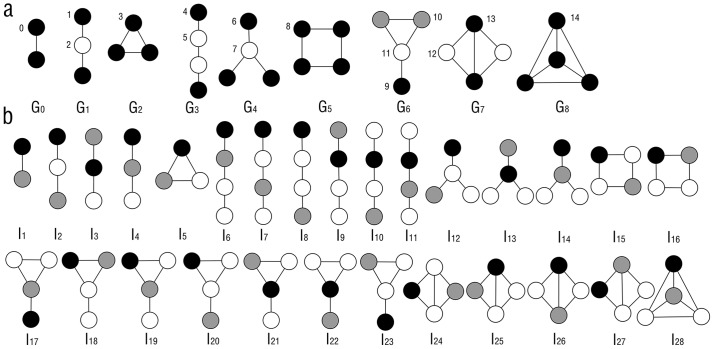
Figure 1. Graphlet and graphlet interaction isomers.
The figure showed the introduction of graphlet and graphlet interaction. a. Graphlet types which were labelled by G0 to G8, and automorphism orbits which were labelled by number 0 to 14. Black, white and gray nodes represented different orbits in the same graphlet. b. Graphlet interaction isomers I1 to I28 between two nodes which were marked with black and gray.

