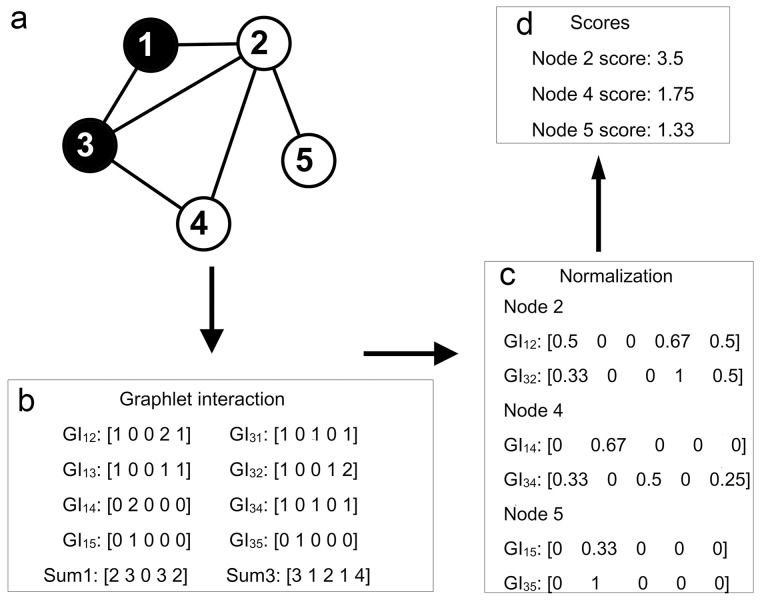
Figure 2. Protocol of disease gene identification using graphlet interaction.
a. The small network was taken, and only 5 types of graphlet interaction isomers (I1 to I5) were considered as an example. The black node 1 and node 3 were known disease genes. The protocol showed how to rank other genes according to known disease genes. b. The first step, calculation of the graphlet interaction between known disease gene (1, 3) and all the other genes. GI was the abbreviation of graphlet interaction, measured by a vector which had 5 elements corresponding to the numbers of the 5 types of graphlet interaction isomers (Figure. 1b I1 to I5). The graphlet interactions from one disease gene were added. Sum1 and Sum3 were the summations of the graphlet interaction vectors from node 1 and node 3. c. The second step, normalization of the graphlet interaction. Every graphlet interaction was divided by the corresponding summation. GI12, GI13, GI14 and GI15 were divided by Sum1, and GI31, GI32, GI34 and GI35 were divided by Sum3. d. The third step, the graphlet interactions from the disease gene to every candidate gene were summated. Then, the elements of the summation were multiplied by the weights, and then added. The score of the node was obtained. For example, to get score of node 2, the normalized GI12 and GI32 were added and the summation vector [0.83 0 0 1.67 1] was obtained. The score was 0.83+0+0+1.67+1 = 3.5 (the weight of every element was 1 here).

