
Figure 4. Time since previous haul-out event.
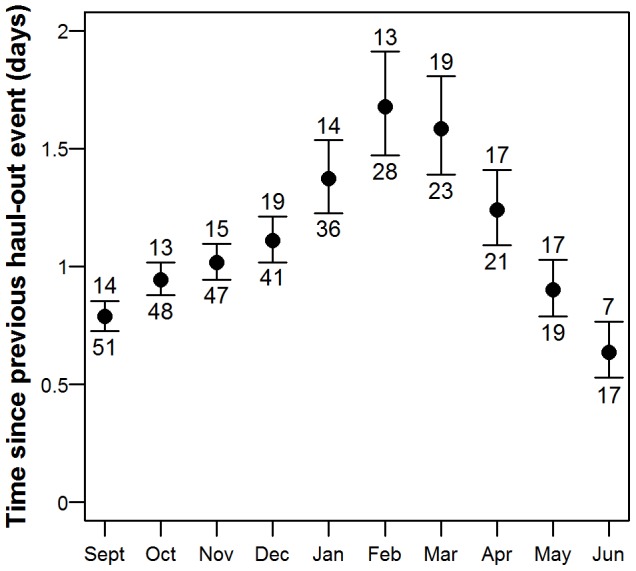
Output from a GAMM model showing the mean number of days (±95% CI) since the previous haul-out period, plotted by month for the 60 harbour seals equipped with Satellite-Relay Data Loggers (SRDLs) in Svalbard, Norway in 2009 and 2010. The number at the top of the CI bar indicates the maximum time between haul-out events (days) for an individual seal and the number at the bottom of the CI bar indicates the number of seals transmitting data in that month.