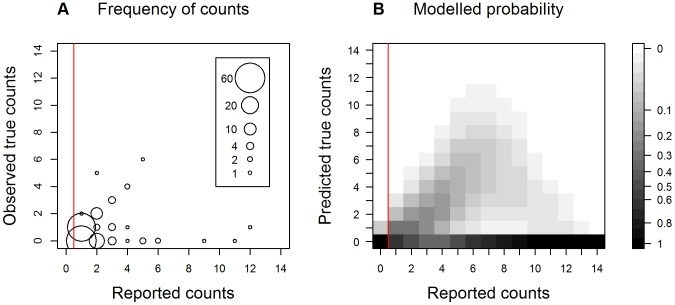
Figure 4. Quantified bias of the citizen science data of counts of parasitoids.
(A) The observed frequency of the true number of parasitoids against the reported number, which was determined from samples retained from participating school children. Frequencies are not shown when the reported number of parasitoids was equal to zero (to the left of the red vertical line). (B) The probability distribution of the true number of parasitoids against the reported number, based on a zero-inflated Poisson regression of a subset of validated records. To the left of the red vertical line the probabilities were directly calculated, while to the right they were estimated from the model.

