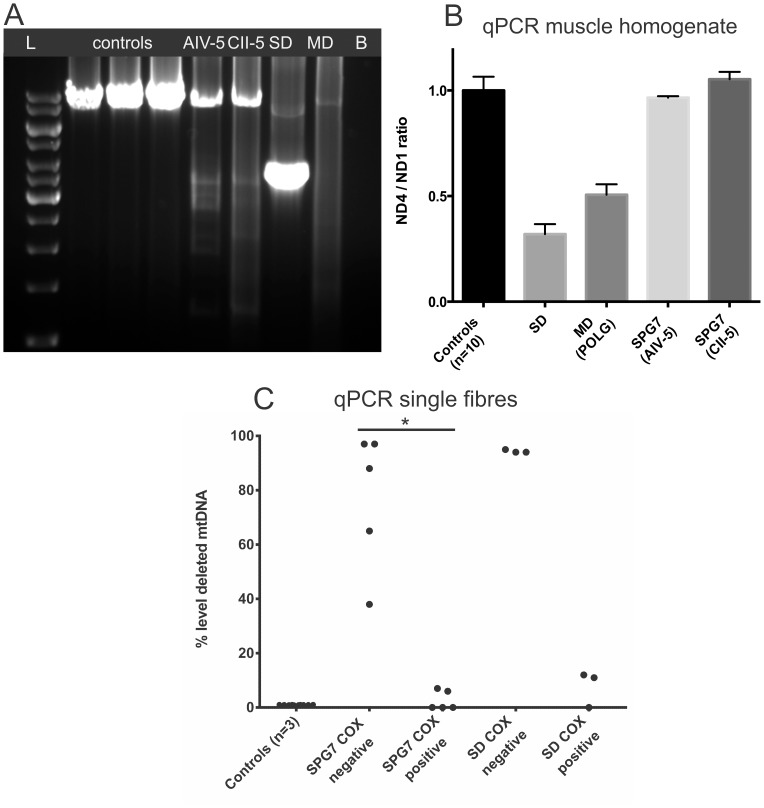
Figure 4. MtDNA studies in the muscle of two SPG7 patients and controls.
MtDNA studies in the muscle of two SPG7 patients (AIV-5 and CII-2) and controls. Results from a patient with a single mtDNA deletion (SD) and a patient with multiple mtDNA deletions due to POLG mutations (MD) are also shown for comparison. A: LPCR of mtDNA shows multiple deletions in the two SPG7 patients. The ladder is 1 kb (GeneRuler). B: blank. B: qPCR of mtDNA in muscle homogenate shows no detectable deletions (ND4/ND1 ratio within the control range) in the SPG7 patients. Low ND4/ND1 ratios consistent with ∼60% and ∼50% deleted mtDNA are found in the patients with single and multiple mtDNA deletions respectively. Error bars mark standard deviations. C: Scatter plot showing the proportion of deleted mtDNA in microdissected COX-positive and COX-negative muscle fibres from an SPG7 patient (AIV-5) and a patient with single mtDNA deletion. Deletions reach significantly higher levels (38–97%) in the COX-negative, than in the COX-positive fibres (0–7%) of the SPG7 patient. No deletions are detected in single fibres from three healthy controls. Each dot represents data from a single fibre. COX: cytochrome-oxidase. *P = 0.008 (comparison by Mann-Whitney test).

