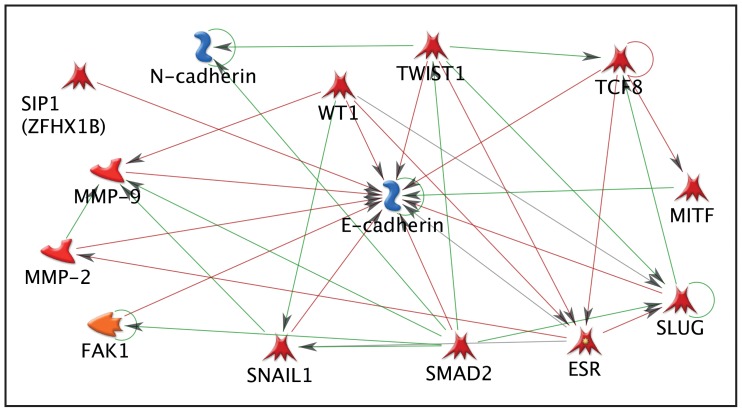
Figure 7. Metacore analysis of genes detected in mouse uterus that were associated with regulation of E cadherin and N cadherin.
To filter data, the full gene array list was input into Metacore™ software and any gene that was found to have no known interaction with E and N cadherin was excluded. Arrows indicate direct effects on other genes in the pathway. Green arrows indicate activation, whereas red arrows show inhibitory action.

