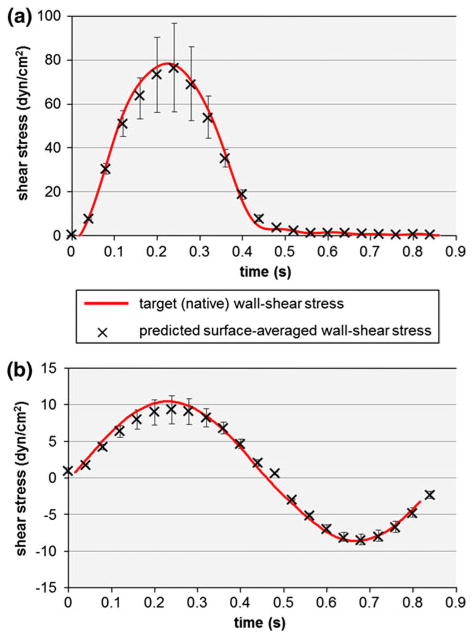
FIGURE 6.
Comparison between the target (native) wall-shear stress and the surface-averaged wall-shear stress predicted by the FSI model over a tissue sample on: (a) the ventricular; and (b) the aortic side of a tissue sample. The error bars indicate the maximum and minimum wall-shear stress values computed over the surface of the tissue sample.

