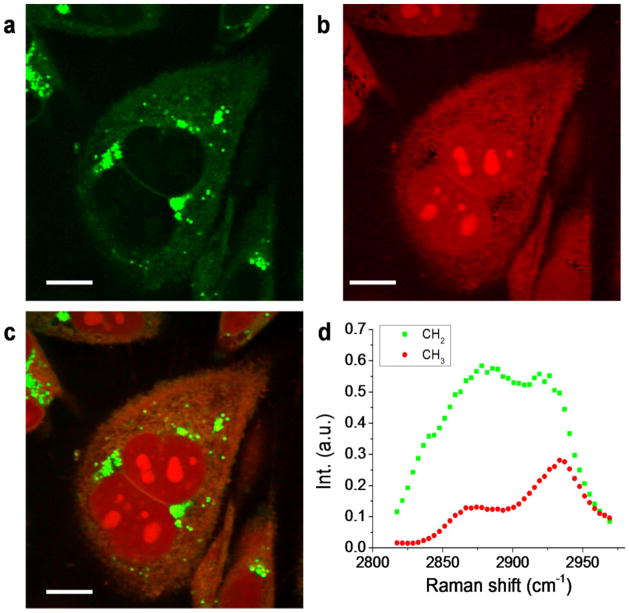
Figure 4. (online color at: www.biophotonics-journal.org) Hyperspectral SRS imaging of PC3 cells.
MCR analysis was performed to decompose the raw data to (a) CH2 and (b) CH3 maps. The merged image is shown in (c). Respective spectral profiles are shown in (d), where green squares and red dots represent CH2 and CH3 spectral profiles, respectively. Scale bars: 10 μm.

