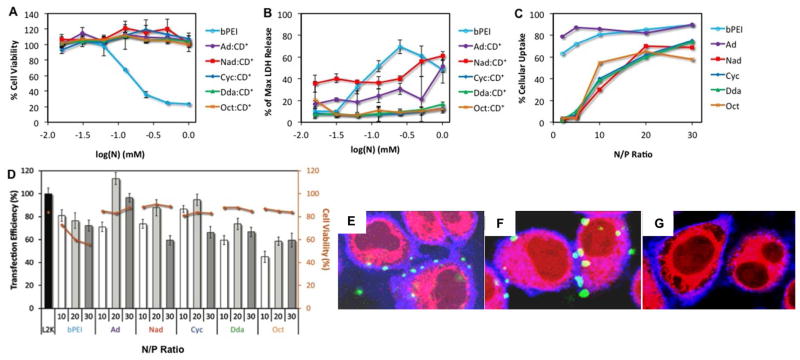
Figure 4.
Biological performance of pDNA:CD+:R-PVA-PEG complexes. (A) MTS viability assay as a function of CD+:R-PVA-PEG and bPEI concentration after 24 h exposure to cationic polymer; (B) LDH cytotoxicity analysis of CD+:R-PVA-PEG and bPEI as a function of CD+:R-PVA-PEG and bPEI concentration after 24 h exposure to cationic polymer; (C) cellular uptake levels of CD+:R-PVA-PEG and bPEI after incubation for 4 h as a percentage of all cells exposed to transfection complexes; at N/P ratio of 10, 20 and 30 (D) two-color flow cytometry in vitro transfection efficiency and 7AAD cytotoxicity analysis of R-PVA-PEG:CD+:pDNA complexes at N/P ratio of 10, 20 and 30 with bPEI and L2k as controls (4 h incubation followed by readout after 24 h with 1 μg AcGFP1 pDNA); confocal microscopy z-stack images of Fl-pDNA:CD+:Ad-PVA-PEG complexes at N/P = 20 incubated at (E) 2 h, (F) 4 h and (G) 9 h. Blue – Alexa 689 WGA-labeled plasma membrane; Red – Lysotracker DND-99-labeled lysosomes, Green – transfection complexes. All experiments were performed using HeLa cells in 10% serum-supplemented media.

