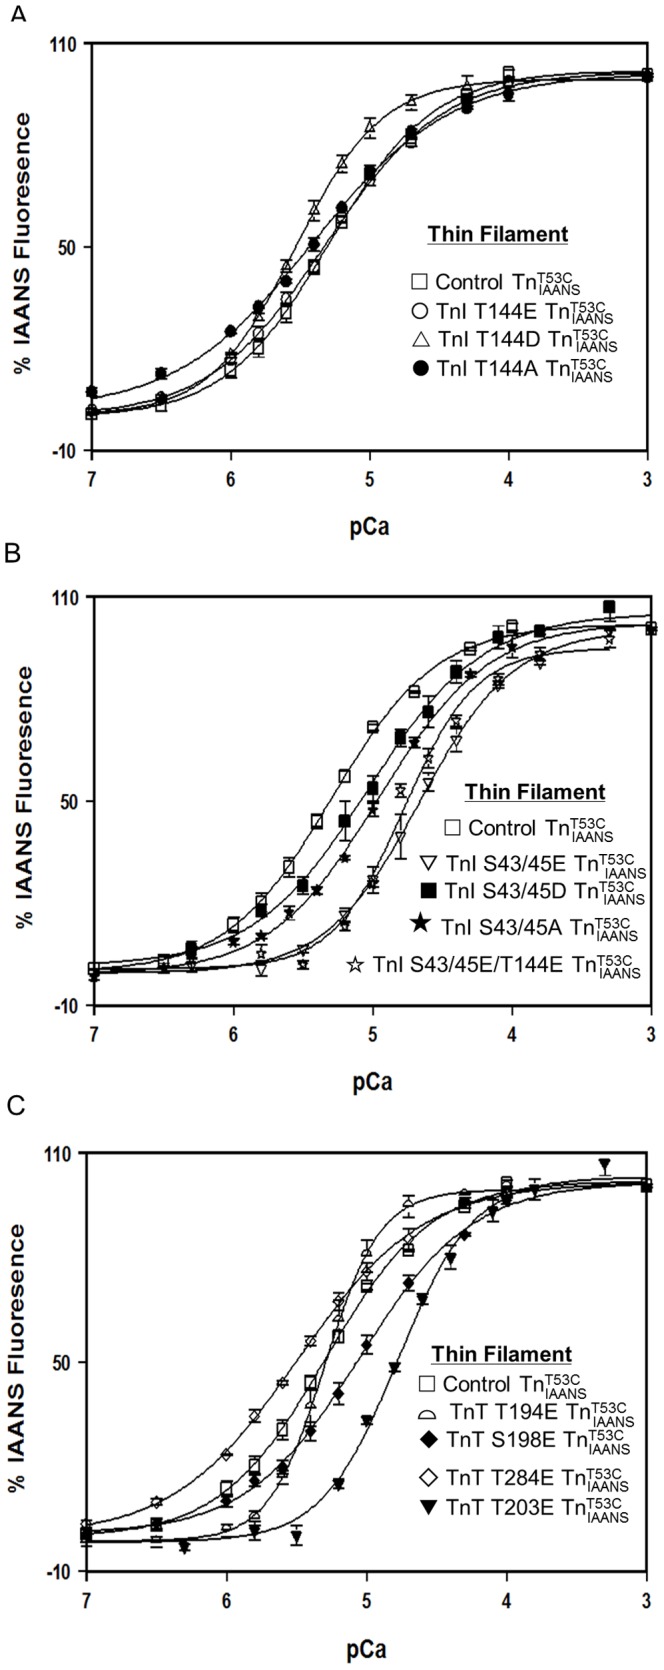
Figure 3. Effect of phosphorylation mimicking protein modifications on the Ca2+ sensitivity of the thin filament.

Panel A shows the Ca2+ dependent increases in IAANS fluorescence for control  (□), TnI T144E
  (○), TnI T144D
  (▵) and TnI T144A
  (•) as a function of pCa. Panel B shows the Ca2+ dependent increases in IAANS fluorescence for control
  (□), TnI S43/45E
  (▽), TnI S43/45D
  (▪), TnI S43/45A
  (★), and TnI S43/45E/T144E
  (☆) as a function of pCa. Panel C shows the Ca2+ dependent increases in IAANS fluorescence for control
  (□), TnT T194E
  (
( ), S198E
  (♦), T284E
  (◊) and TnT T203E
  (▾) as a function of pCa. The data sets were normalized individually for each mutant.
