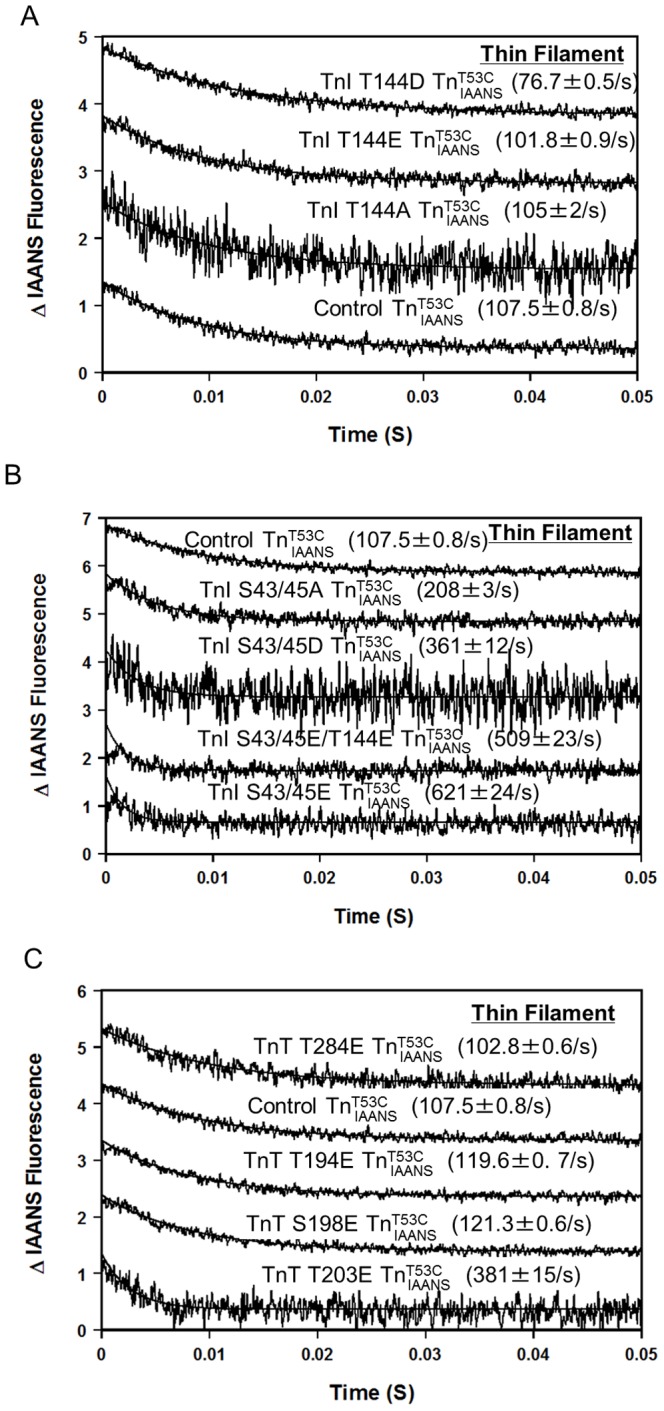
Figure 4. Effect of phosphorylation mimicking protein modifications on the rate of Ca2+ dissociation from the thin filament.

Panel A shows the time courses of the decrease in IAANS fluorescence as Ca2+ was removed by EGTA from control  , TnI T144E
  , TnI T144D
  and TnI T144A
  . Panel B shows the time courses of the decrease in IAANS fluorescence as Ca2+ was removed by EGTA from control
  , TnI S43/45E
  , TnI S43/45D
  , TnI S43/45A
  , and TnI S43/45E/T144E
  . Panel C shows the time courses of the decrease in IAANS fluorescence as Ca2+ was removed by EGTA from control
  , TnT T194E
  , S198E
  , T284E
  and TnT T203E
  . The data traces have been staggered and normalized for clarity.
