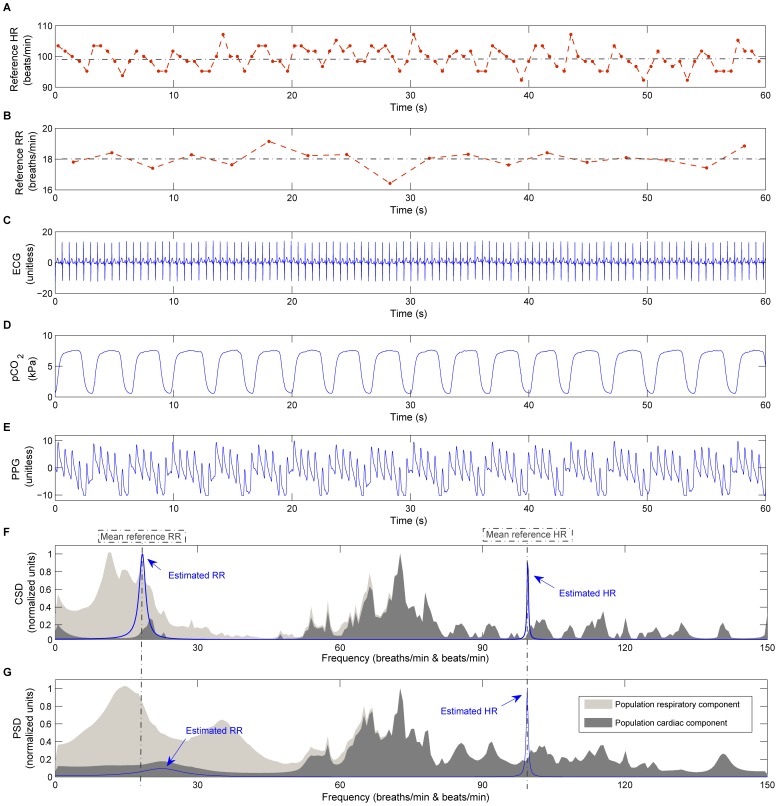
Figure 6. CSD applied to an in-vivo signal.
CSD and PSD performance applied to an in-vivo signal (1 min) of one infant subject: (A) reference HR (dotted red line with  markers) and mean HR represented by a dotted grey line, (B) reference RR (dotted red line with
  markers) and mean RR represented by a dotted grey line, (C) ECG signal, (D) capnometry, (E) PPG signal, (F) CSD and (G) PSD applied to the PPG signal. In addition, the average CSD and PSD spectrum of the database’s population is illustrated in the background on (F) and (G) respectively, where the cardiac component is represented in dark grey and the filtered signal that corresponds to respiration in light grey.

