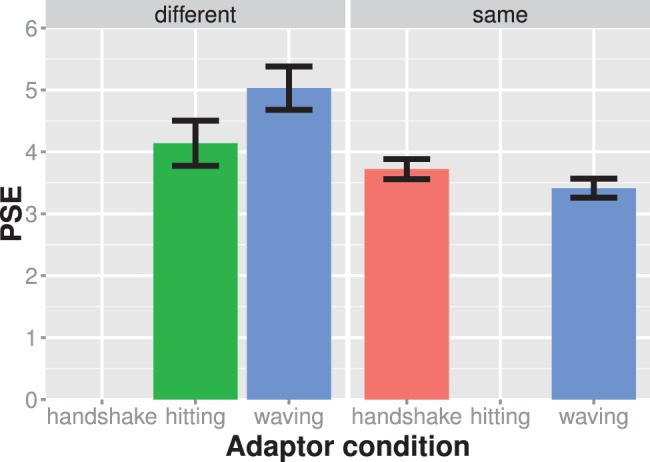
Figure 5. Results of experiment 3.

The average PSE is shown for each experiment condition (different panels) and adaptor condition separately. The left panel shows the different emotion condition and the right panel shows the same emotion condition. Larger PSE values indicate that the test stimulus showed more of a waving action. Bars always indicate one standard error of the mean.
